
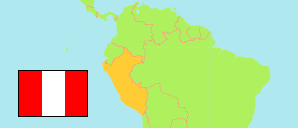
Las Lomas
District in Piura Region
Contents: Population
The population development of Las Lomas as well as related information and services (Wikipedia, Google, images).
| Name | Status | Population Census 1993-07-11 | Population Census 2007-10-21 | Population Census 2017-10-22 | Population Census 2025-08-04 | |
|---|---|---|---|---|---|---|
| Las Lomas | District | 26,302 | 26,896 | 28,287 | 30,573 | |
| Piura | Region | 1,388,264 | 1,676,315 | 1,929,970 | 2,115,215 |
Source: Instituto Nacional de Estadística e Informática, Peru.
Explanation: The tabulated results of the 1993 and the 2017 census are not adjusted for underenumeration. Area figures of districts are calculated by using geospatial data.
Further information about the population structure:
| Gender (C 2025) | |
|---|---|
| Males | 15,533 |
| Females | 15,040 |
| Age Groups (C 2017) | |
|---|---|
| 0-14 years | 9,239 |
| 15-64 years | 16,809 |
| 65+ years | 2,239 |
| Age Distribution (C 2017) | |
|---|---|
| 90+ years | 88 |
| 80-89 years | 484 |
| 70-79 years | 975 |
| 60-69 years | 1,698 |
| 50-59 years | 2,641 |
| 40-49 years | 3,248 |
| 30-39 years | 3,776 |
| 20-29 years | 3,848 |
| 10-19 years | 5,435 |
| 0-9 years | 6,094 |
| Urbanization (C 2017) | |
|---|---|
| Rural | 15,332 |
| Urban | 12,955 |
| Literacy (A3+) (C 2017) | |
|---|---|
| yes | 22,434 |
| no | 4,279 |
| Ethnic Group (A12+) (C 2017) | |
|---|---|
| Quechua | 90 |
| Aymara | 7 |
| Afro-Peruvian | 1,770 |
| White | 2,662 |
| Mestizo | 16,093 |
| Other group | 48 |
| Religion (A12+) (C 2017) | |
|---|---|
| Catholics | 17,912 |
| Evangelicals | 1,995 |
| Other religion | 701 |
| No religion | 336 |
| Population (C 2025) | |
|---|---|
| Counted | 30,313 |
| Estimated | 260 |