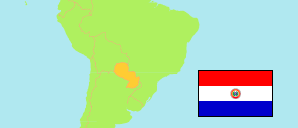
Minga Porá
District in Paraguay
Contents: Population
The population development of Minga Porá as well as related information and services (Wikipedia, Google, images).
| Name | Status | Population Estimate 2000-07-01 | Population Estimate 2005-07-01 | Population Estimate 2010-07-01 | Population Projection 2015-07-01 | Population Projection 2020-07-01 | |
|---|---|---|---|---|---|---|---|
| Minga Porá | District | 11,472 | 12,731 | 13,736 | 14,526 | 15,156 | |
| Paraguay | Pepublic | 5,284,480 | 5,779,768 | 6,265,877 | 6,755,757 | 7,252,672 |
Source: Paraguay Dirección General de Estadísticas, Encuestas y Censos (web).
Explanation: Area figures of districts are calculated from geospatial data.
Further information about the population structure:
| Gender (P 2020) | |
|---|---|
| Males | 7,920 |
| Females | 7,236 |
| Age Groups (P 2020) | |
|---|---|
| 0-14 years | 4,545 |
| 15-64 years | 9,882 |
| 65+ years | 730 |
| Age Distribution (P 2020) | |
|---|---|
| 0-9 years | 3,027 |
| 10-19 years | 3,021 |
| 20-29 years | 2,695 |
| 30-39 years | 2,291 |
| 40-49 years | 1,712 |
| 50-59 years | 1,242 |
| 60-69 years | 755 |
| 70-79 years | 312 |
| 80+ years | 101 |