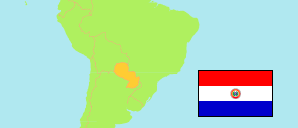
Ñeembucú
Department in Paraguay
Contents: Subdivision
The population development in Ñeembucú as well as related information and services (Wikipedia, Google, images).
| Name | Status | Population Estimate 2000-07-01 | Population Estimate 2005-07-01 | Population Estimate 2010-07-01 | Population Projection 2015-07-01 | Population Projection 2020-07-01 | |
|---|---|---|---|---|---|---|---|
| Ñeembucú | Department | 79,925 | 82,533 | 85,129 | 87,750 | 90,287 | |
| Alberdi | District | 7,526 | 8,008 | 8,509 | 9,034 | 9,571 | → |
| Cerrito | District | 4,837 | 5,061 | 5,289 | 5,522 | 5,754 | → |
| Desmochados | District | 1,700 | 1,728 | 1,754 | 1,780 | 1,803 | → |
| General José Eduvigis Díaz | District | 3,841 | 3,899 | 3,954 | 4,005 | 4,048 | → |
| Guazú Cuá | District | 2,026 | 2,073 | 2,117 | 2,161 | 2,201 | → |
| Humaitá | District | 3,059 | 3,074 | 3,086 | 3,095 | 3,098 | → |
| Isla Umbú | District | 2,945 | 2,969 | 2,989 | 3,007 | 3,019 | → |
| Laureles | District | 3,426 | 3,459 | 3,487 | 3,512 | 3,529 | → |
| Mayor José Martínez | District | 4,125 | 4,169 | 4,207 | 4,242 | 4,267 | → |
| Paso de Patria | District | 1,775 | 1,864 | 1,959 | 2,060 | 2,166 | → |
| Pilar | District | 29,269 | 30,275 | 31,262 | 32,242 | 33,174 | → |
| San Juan Bautista del Ñeembucú | District | 5,447 | 5,580 | 5,707 | 5,833 | 5,948 | → |
| Tacuaras | District | 3,425 | 3,557 | 3,689 | 3,823 | 3,953 | → |
| Villa Franca | District | 932 | 1,038 | 1,154 | 1,284 | 1,426 | → |
| Villalbín | District | 2,186 | 2,265 | 2,343 | 2,422 | 2,499 | → |
| Villa Oliva | District | 3,407 | 3,516 | 3,622 | 3,729 | 3,831 | → |
| Paraguay | Pepublic | 5,284,480 | 5,779,768 | 6,265,877 | 6,755,757 | 7,252,672 |
Source: Paraguay Dirección General de Estadísticas, Encuestas y Censos (web).
Explanation: Area figures of districts are calculated from geospatial data.
Further information about the population structure:
| Gender (P 2020) | |
|---|---|
| Males | 45,231 |
| Females | 45,056 |
| Age Groups (P 2020) | |
|---|---|
| 0-14 years | 21,993 |
| 15-64 years | 58,524 |
| 65+ years | 9,770 |
| Age Distribution (P 2020) | |
|---|---|
| 0-9 years | 14,570 |
| 10-19 years | 14,653 |
| 20-29 years | 13,432 |
| 30-39 years | 13,502 |
| 40-49 years | 10,852 |
| 50-59 years | 9,549 |
| 60-69 years | 7,326 |
| 70-79 years | 4,285 |
| 80+ years | 2,119 |