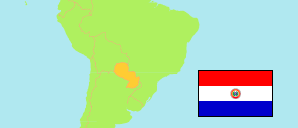
Caaguazú
Department in Paraguay
Contents: Subdivision
The population development in Caaguazú as well as related information and services (Wikipedia, Google, images).
| Name | Status | Population Census 2002-08-28 | Population Census 2022-11-09 | |
|---|---|---|---|---|
| Caaguazú | Department | 435,357 | 431,519 | |
| Caaguazú | District | 98,136 | 98,200 | → |
| Carayaó | District | 13,234 | 10,832 | → |
| Coronel Oviedo | District | 84,103 | 98,323 | → |
| Doctor Cecilio Báez | District | 6,173 | 4,812 | → |
| Doctor Juan Eulogio Estigarribia | District | 24,634 | 38,894 | → |
| Doctor Juan Manuel Frutos | District | 19,128 | 20,451 | → |
| José Domingo Ocampos | District | 9,198 | 7,459 | → |
| La Pastora | District | 4,440 | 3,294 | → |
| Mariscal Francisco Solano López | District | 7,330 | 5,338 | → |
| Nueva Londres | District | 4,110 | 3,594 | → |
| Nueva Toledo | District | 3,655 | 4,826 | → |
| Raúl Arsenio Oviedo | District | 12,638 | 12,543 | → |
| Repatriación | District | 29,503 | 24,459 | → |
| R. I. Tres Corrales | District | 7,666 | 6,021 | → |
| San Joaquín | District | 14,930 | 11,949 | → |
| San José de los Arroyos | District | 15,299 | 13,926 | → |
| Santa Rosa del Mbutuy | District | 10,989 | 8,467 | → |
| Simón Bolívar | District | 4,938 | 4,740 | → |
| Tembiaporá | District | 11,441 | 12,877 | → |
| Tres de Febrero (3 de Febrero) | District | 8,818 | 7,492 | → |
| Vaquería | District | 10,257 | 10,498 | → |
| Yhú | District | 34,737 | 22,524 | → |
| Paraguay | Pepublic | 5,163,198 | 6,109,903 |
Source: Paraguay Dirección General de Estadísticas, Encuestas y Censos.
Explanation: Area figures of districts are calculated from geospatial data.
Further information about the population structure:
| Gender (C 2022) | |
|---|---|
| Males | 218,731 |
| Females | 212,788 |
| Age Groups (C 2022) | |
|---|---|
| 0-14 years | 117,387 |
| 15-64 years | 275,820 |
| 65+ years | 38,312 |
| Age Distribution (C 2022) | |
|---|---|
| 90+ years | 1,270 |
| 80-89 years | 6,500 |
| 70-79 years | 16,390 |
| 60-69 years | 31,393 |
| 50-59 years | 41,129 |
| 40-49 years | 48,141 |
| 30-39 years | 62,112 |
| 20-29 years | 68,058 |
| 10-19 years | 78,978 |
| 0-9 years | 77,548 |
| Urbanization (C 2022) | |
|---|---|
| Rural | 241,013 |
| Urban | 190,506 |
