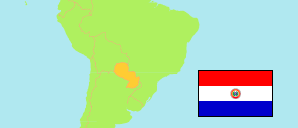
Cordillera
Department in Paraguay
Contents: Subdivision
The population development in Cordillera as well as related information and services (Wikipedia, Google, images).
| Name | Status | Population Census 2002-08-28 | Population Census 2022-11-09 | |
|---|---|---|---|---|
| Cordillera | Department | 233,854 | 268,037 | |
| Altos | District | 11,496 | 14,641 | → |
| Arroyos y Esteros | District | 19,001 | 20,347 | → |
| Atyrá | District | 13,310 | 15,988 | → |
| Caacupé | District | 42,127 | 50,409 | → |
| Caraguatay | District | 11,568 | 10,143 | → |
| Emboscada | District | 12,225 | 21,182 | → |
| Eusebio Ayala | District | 17,968 | 19,334 | → |
| Isla Pucú | District | 6,643 | 5,304 | → |
| Itacurubí de la Cordillera | District | 9,859 | 8,961 | → |
| Juan de Mena | District | 5,486 | 6,341 | → |
| Loma Grande | District | 2,858 | 3,836 | → |
| Mbocayaty del Yhaguy | District | 4,051 | 3,316 | → |
| Nueva Colombia | District | 3,565 | 4,602 | → |
| Piribebuy | District | 19,594 | 25,758 | → |
| Primero de Marzo | District | 6,019 | 4,997 | → |
| San Bernardino | District | 9,491 | 12,216 | → |
| San José Obrero | District | 4,014 | 2,974 | → |
| Santa Elena | District | 5,703 | 4,346 | → |
| Tobatí | District | 23,295 | 27,435 | → |
| Valenzuela | District | 5,581 | 5,907 | → |
| Paraguay | Pepublic | 5,163,198 | 6,109,903 |
Source: Paraguay Dirección General de Estadísticas, Encuestas y Censos.
Explanation: Area figures of districts are calculated from geospatial data.
Further information about the population structure:
| Gender (C 2022) | |
|---|---|
| Males | 137,118 |
| Females | 130,919 |
| Age Groups (C 2022) | |
|---|---|
| 0-14 years | 63,187 |
| 15-64 years | 176,105 |
| 65+ years | 28,745 |
| Age Distribution (C 2022) | |
|---|---|
| 90+ years | 1,120 |
| 80-89 years | 5,198 |
| 70-79 years | 12,399 |
| 60-69 years | 21,799 |
| 50-59 years | 26,406 |
| 40-49 years | 31,710 |
| 30-39 years | 39,823 |
| 20-29 years | 43,794 |
| 10-19 years | 44,497 |
| 0-9 years | 41,291 |
| Urbanization (C 2022) | |
|---|---|
| Rural | 159,655 |
| Urban | 108,382 |