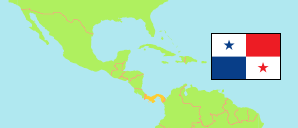
Colón
Province in Panama
Contents: Subdivision
The population in Colón as well as related information and services (Wikipedia, Google, images).
| Name | Status | Population Census 2023-01-08 | |
|---|---|---|---|
| Colón | Province | 281,956 | |
| Achiote | Township | 938 | → |
| Barrio Norte | Township | 12,320 | → |
| Barrio Sur | Township | 6,463 | → |
| Buena Vista | Township | 19,221 | → |
| Cacique | Township | 308 | → |
| Cativá | Township | 37,000 | → |
| Ciricito | Township | 3,174 | → |
| Coclé del Norte | Township | 4,301 | → |
| Cristóbal | Township | 10,466 | → |
| Cristóbal Este | Township | 64,816 | → |
| Cuango | Township | 624 | → |
| El Guabo | Township | 1,553 | → |
| El Guásimo | Township | 3,494 | → |
| Escobal | Township | 2,293 | → |
| Gobea | Township | 927 | → |
| Isla Grande | Township | 988 | → |
| La Encantada | Township | 2,333 | → |
| Limón | Township | 5,546 | → |
| María Chiquita | Township | 3,103 | → |
| Miguel de la Borda | Township | 2,408 | → |
| Miramar | Township | 389 | → |
| Nombre de Dios | Township | 1,127 | → |
| Nueva Esperanza | Township | 889 | → |
| Nueva Providencia | Township | 8,734 | → |
| Nuevo Chagres | Township | 567 | → |
| Palenque | Township | 508 | → |
| Palmas Bellas | Township | 2,151 | → |
| Palmira | Township | 404 | → |
| Piña | Township | 888 | → |
| Playa Chiquita | Township | 196 | → |
| Portobelo | Township | 4,910 | → |
| Puerto Lindo (Garrote) | Township | 1,011 | → |
| Puerto Pilón | Township | 18,285 | → |
| Río Indio | Township | 1,144 | → |
| Sabanitas | Township | 23,630 | → |
| Salamanca | Township | 5,043 | → |
| Salud | Township | 2,538 | → |
| San José del General | Township | 1,865 | → |
| San Juan | Township | 22,499 | → |
| San Juan de Turbe | Township | 807 | → |
| Santa Isabel | Township | 276 | → |
| Santa Rosa | Township | 1,232 | → |
| Viento Frío | Township | 587 | → |
| Panamá | Republic | 4,202,572 |
Source: Instituto Nacional de Estadística y Censo, Panamá.
Explanation: The tabulated census results are not adjusted for underenumeration. The 2023 total population includes 137,792 persons taken from administrative registers; they are not included in the province and township figures. Area figures of townships are computed using geospatial data.
Further information about the population structure:
| Gender (C 2023) | |
|---|---|
| Males | 139,873 |
| Females | 142,083 |
| Age Groups (C 2023) | |
|---|---|
| 0-14 years | 78,596 |
| 15-64 years | 181,376 |
| 65+ years | 21,952 |
| Age Distribution (C 2023) | |
|---|---|
| 90+ years | 800 |
| 80-89 years | 3,663 |
| 70-79 years | 9,710 |
| 60-69 years | 18,055 |
| 50-59 years | 27,970 |
| 40-49 years | 33,394 |
| 30-39 years | 39,888 |
| 20-29 years | 45,687 |
| 10-19 years | 51,462 |
| 0-9 years | 51,295 |
| Urbanization (C 2023) | |
|---|---|
| Rural | 96,467 |
| Urban | 185,489 |
| Ethnic Group (C 2023) | |
|---|---|
| Ngäbe | 3,994 |
| Guna | 6,414 |
| Other Indigenous | 5,337 |
| African, Not Indigenous | 170,099 |
| Not African, Not Indigenous | 96,112 |