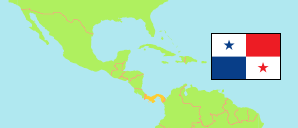
Bocas del Toro
Province in Panama
Contents: Subdivision
The population development in Bocas del Toro as well as related information and services (Wikipedia, Google, images).
| Name | Status | Population Census 2000-05-14 | Population Census 2010-05-16 | Population Census 2023-01-08 | |
|---|---|---|---|---|---|
| Bocas del Toro | Province | 89,269 | 125,461 | 159,228 | |
| Almirante (← Changuinola) | District | 17,752 | 24,265 | 28,368 | → |
| Bocas del Toro | District | 9,916 | 16,135 | 17,274 | → |
| Changuinola | District | 54,170 | 74,045 | 101,091 | → |
| Chiriquí Grande | District | 7,431 | 11,016 | 12,495 | → |
| Panamá | Republic | 2,839,177 | 3,405,813 | 4,202,572 |
Source: Instituto Nacional de Estadística y Censo, Panamá.
Explanation: The tabulated census results are not adjusted for underenumeration. The 2023 total population includes 137,792 persons taken from administrative registers; they are not included in the province and districts figures. Area figures of districts are computed using geospatial data.
Further information about the population structure:
| Gender (C 2023) | |
|---|---|
| Males | 79,938 |
| Females | 79,290 |
| Age Groups (C 2023) | |
|---|---|
| 0-14 years | 61,138 |
| 15-64 years | 90,268 |
| 65+ years | 7,822 |
| Age Distribution (C 2023) | |
|---|---|
| 90+ years | 209 |
| 80-89 years | 1,208 |
| 70-79 years | 3,693 |
| 60-69 years | 6,570 |
| 50-59 years | 10,722 |
| 40-49 years | 14,545 |
| 30-39 years | 19,159 |
| 20-29 years | 25,283 |
| 10-19 years | 35,925 |
| 0-9 years | 41,914 |
| Urbanization (C 2023) | |
|---|---|
| Rural | 95,678 |
| Urban | 63,550 |
| Ethnic Group (C 2023) | |
|---|---|
| Ngäbe | 107,851 |
| Guna | 549 |
| Other Indigenous | 7,969 |
| African, Not Indigenous | 21,003 |
| Not African, Not Indigenous | 21,856 |