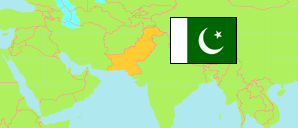
Kot Addu
Tehsil in Pakistan
Contents: Population
The population development of Kot Addu as well as related information and services (Wikipedia, Google, images).
| Name | Status | Population Census 1998-03-01 | Population Census 2017-03-15 | |
|---|---|---|---|---|
| Kot Addu | Tehsil | 808,438 | 1,347,501 | |
| Pakistan | Republic | 132,352,279 | 207,684,626 |
Source: Pakistan Bureau of Statistics.
Explanation: The Pakistani-administered parts of Kashmir are not tabulated. Districts in 2023 boundaries.
Further information about the population structure:
| Gender (C 2017) | |
|---|---|
| Males | 689,962 |
| Females | 657,460 |
| Transgender | 79 |
| Age Groups (C 2017) | |
|---|---|
| 0-14 years | 607,176 |
| 15-64 years | 695,129 |
| 65+ years | 45,196 |
| Age Distribution (C 2017) | |
|---|---|
| 0-9 years | 431,416 |
| 10-19 years | 312,036 |
| 20-29 years | 209,677 |
| 30-39 years | 160,907 |
| 40-49 years | 99,246 |
| 50-59 years | 65,708 |
| 60-69 years | 40,659 |
| 70+ years | 27,852 |
| Urbanization (C 2017) | |
|---|---|
| Rural | 1,093,354 |
| Urban | 254,147 |
| Literacy (A10+) (C 2017) | |
|---|---|
| yes | 506,101 |
| no | 409,984 |
| Mother Tongue (C 2017) | |
|---|---|
| Urdu | 71,426 |
| Punjabi | 161,243 |
| Sindhi | 1,162 |
| Pushto | 37,356 |
| Balochi | 7,818 |
| Kashmiri | 96 |
| Saraiki | 1,065,249 |
| Hindko | 492 |
| Brahvi | 541 |
| Other Language | 2,118 |