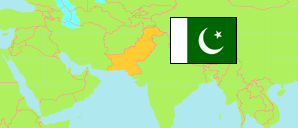
Kot Chutta
Tehsil in Pakistan
Contents: Population
The population development of Kot Chutta as well as related information and services (Wikipedia, Google, images).
| Name | Status | Population Census 1998-03-01 | Population Census 2017-03-15 | |
|---|---|---|---|---|
| Kot Chutta | Tehsil | 438,306 | 757,230 | |
| Pakistan | Republic | 132,352,279 | 207,684,626 |
Source: Pakistan Bureau of Statistics.
Explanation: The Pakistani-administered parts of Kashmir are not tabulated. Districts in 2023 boundaries.
Further information about the population structure:
| Gender (C 2017) | |
|---|---|
| Males | 379,475 |
| Females | 377,704 |
| Transgender | 51 |
| Age Groups (C 2017) | |
|---|---|
| 0-14 years | 367,084 |
| 15-64 years | 362,099 |
| 65+ years | 28,047 |
| Age Distribution (C 2017) | |
|---|---|
| 0-9 years | 265,910 |
| 10-19 years | 174,338 |
| 20-29 years | 109,779 |
| 30-39 years | 80,356 |
| 40-49 years | 51,818 |
| 50-59 years | 33,866 |
| 60-69 years | 23,521 |
| 70+ years | 17,642 |
| Urbanization (C 2017) | |
|---|---|
| Rural | 705,564 |
| Urban | 51,666 |
| Literacy (A10+) (C 2017) | |
|---|---|
| yes | 182,794 |
| no | 308,526 |
| Mother Tongue (C 2017) | |
|---|---|
| Urdu | 10,347 |
| Punjabi | 4,259 |
| Sindhi | 611 |
| Pushto | 3,914 |
| Balochi | 53,623 |
| Kashmiri | 19 |
| Saraiki | 682,634 |
| Hindko | 24 |
| Brahvi | 325 |
| Other Language | 1,474 |