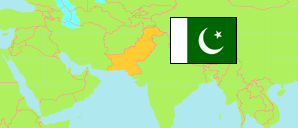
Rawalpindi
District in Pakistan
Contents: Subdivision
The population development in Rawalpindi as well as related information and services (Wikipedia, Google, images).
| Name | Status | Population Census 1998-03-01 | Population Census 2017-03-15 | |
|---|---|---|---|---|
| Rawalpindi | District | 3,363,911 | 5,402,380 | |
| Gujar Khan | Tehsil | 494,010 | 678,062 | → |
| Kahuta | Tehsil | 153,719 | 220,746 | → |
| Kallar Sayyedan | Tehsil | 158,120 | 217,061 | → |
| Kotli Sattian | Tehsil | 82,711 | 119,295 | → |
| Murree | Tehsil | 176,599 | 233,017 | → |
| Rawalpindi | Tehsil | 1,927,612 | 3,256,641 | → |
| Taxila | Tehsil | 371,140 | 677,558 | → |
| Pakistan | Republic | 132,352,279 | 207,684,626 |
Source: Pakistan Bureau of Statistics.
Explanation: The Pakistani-administered parts of Kashmir are not tabulated. Districts in 2023 boundaries.
Further information about the population structure:
| Gender (C 2017) | |
|---|---|
| Males | 2,736,180 |
| Females | 2,665,089 |
| Transgender | 1,111 |
| Age Groups (C 2017) | |
|---|---|
| 0-14 years | 1,800,127 |
| 15-64 years | 3,356,182 |
| 65+ years | 246,071 |
| Age Distribution (C 2017) | |
|---|---|
| 0-9 years | 1,243,221 |
| 10-19 years | 1,084,364 |
| 20-29 years | 969,529 |
| 30-39 years | 786,091 |
| 40-49 years | 540,859 |
| 50-59 years | 389,436 |
| 60-69 years | 240,132 |
| 70+ years | 148,748 |
| Urbanization (C 2017) | |
|---|---|
| Rural | 2,396,672 |
| Urban | 3,005,708 |
| Literacy (A10+) (C 2017) | |
|---|---|
| yes | 3,429,112 |
| no | 730,047 |
| Mother Tongue (C 2017) | |
|---|---|
| Urdu | 548,517 |
| Punjabi | 3,711,221 |
| Sindhi | 10,280 |
| Pushto | 588,570 |
| Balochi | 3,304 |
| Kashmiri | 97,545 |
| Saraiki | 51,512 |
| Hindko | 170,677 |
| Brahvi | 3,662 |
| Other Language | 217,092 |