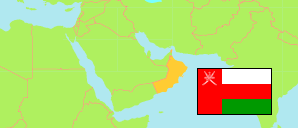
Maṭraḥ
District in Oman
Contents: Population
The population development of Maṭraḥ as well as related information and services (Wikipedia, Google, images).
| Name | Status | Native | Population Census 2003-12-07 | Population Census 2010-12-12 | Population Census 2020-12-12 | |
|---|---|---|---|---|---|---|
| Maṭraḥ [Muttrah] | District | مطرح | 153,526 | 150,124 | 230,881 | |
| ʻUmān [Oman] | Sultanate | عمان | 2,340,815 | 2,773,479 | 4,617,927 |
Source: Sultanate of Oman, National Centre for Statistics and Information (web).
Explanation: The 2020 census was organized as an electronic census.
Further information about the population structure:
| Gender (C 2020) | |
|---|---|
| Males | 160,036 |
| Females | 70,845 |
| Age Groups (C 2020) | |
|---|---|
| 0-14 years | 43,259 |
| 15-64 years | 181,784 |
| 65+ years | 5,838 |
| Age Distribution (C 2020) | |
|---|---|
| 0-9 years | 31,268 |
| 10-19 years | 21,115 |
| 20-29 years | 35,724 |
| 30-39 years | 66,474 |
| 40-49 years | 43,142 |
| 50-59 years | 21,334 |
| 60-69 years | 8,841 |
| 70-79 years | 2,206 |
| 80+ years | 777 |
| Citizenship (C 2020) | |
|---|---|
| Oman | 39,099 |
| Foreign Citizenship | 191,782 |
