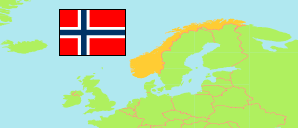
Mo
Statistical Area in Oslofjord
Contents: Population
The population development of Mo as well as related information and services (Wikipedia, Google, images).
| Name | Status | Population Estimate 2000-01-01 | Population Estimate 2006-01-01 | Population Estimate 2013-01-01 | Population Estimate 2020-01-01 | Population Estimate 2025-01-01 | |
|---|---|---|---|---|---|---|---|
| Mo | Statistical Area | 505 | 493 | 507 | 543 | 569 | |
| Oslofjorden [Oslofjord] | 1,370,013 | 1,447,704 | 1,629,375 | 1,783,859 | 1,886,118 |
Source: Statistics Norway.
Further information about the population structure:
| Gender (E 2025) | |
|---|---|
| Males | 298 |
| Females | 271 |
| Age Groups (E 2025) | |
|---|---|
| 0-19 years | 130 |
| 20-66 years | 354 |
| 67+ years | 85 |