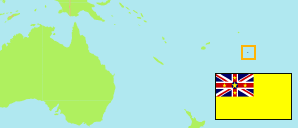
Niue is an island country in free association with New Zealand.
Island
The population development of Niue according to census results.
| Name | Abbr. | Area A (km²) | Population Census (C) 1981-09-28 | Population Census (C) 1986-10-29 | Population Census (C) 1991-11-03 | Population Census (C) 1997-08-17 | Population Census (C) 2001-09-13 | Population Census (C) 2006-09-09 | Population Census (C) 2011-09-10 | Population Census (C) 2017-03-09 | Population Census (Cp) 2022-11-11 | |||
|---|---|---|---|---|---|---|---|---|---|---|---|---|---|---|
| Niue | NIU | 261 | 3,281 | 2,531 | 2,239 | 2,088 | 1,788 | 1,625 | 1,607 | 1,784 | 1,689 |
- Until 2006, the de-facto population is tabulated. The later figures correspond to the usual residents.
- Niue Statistics / PRISM (web).
Contents: Villages
The population of the villages on Niue by census years.
| Name | Population Census (C) 1981-09-28 | Population Census (C) 1986-10-29 | Population Census (C) 1991-11-03 | Population Census (C) 1997-08-17 | Population Census (C) 2001-09-08 | Population Census (C) 2006-09-09 | Population Census (C) 2011-09-10 | Population Census (C) 2017-03-09 | Population Census (Cp) 2022-11-11 | Area | |
|---|---|---|---|---|---|---|---|---|---|---|---|
| Alofi (incl. Alofi South, Alofi North) | 978 | 811 | 682 | 732 | 614 | 581 | 614 | 597 | 606 | 4648 | |
| Avatele | 274 | 195 | 185 | 143 | 125 | 164 | 137 | 143 | 135 | 1399 | |
| Hakupu | 337 | 244 | 258 | 258 | 227 | 162 | 144 | 220 | 197 | 4804 | |
| Hikutavake | 169 | 117 | 83 | 68 | 65 | 56 | 40 | 49 | 38 | 1017 | |
| Lakepa | 149 | 139 | 115 | 125 | 88 | 72 | 70 | 87 | 110 | 2158 | |
| Liku | 182 | 116 | 126 | 92 | 73 | 62 | 74 | 98 | 74 | 4164 | |
| Makefu | 136 | 124 | 117 | 95 | 87 | 62 | 64 | 70 | 83 | 1713 | |
| Mutalau | 276 | 188 | 166 | 148 | 133 | 85 | 97 | 100 | 94 | 2631 | |
| Namukulu | 87 | 53 | 45 | 28 | 14 | 14 | 12 | 11 | 8 | 148 | |
| Tamakautoga | 260 | 182 | 184 | 150 | 140 | 157 | 136 | 160 | 134 | 1193 | |
| Toi | 119 | 91 | 41 | 35 | 31 | 31 | 25 | 22 | 33 | 477 | |
| Tuapa | 252 | 235 | 197 | 168 | 129 | 120 | 97 | 112 | 91 | 1254 | |
| Vaiea | 62 | 36 | 40 | 46 | 62 | 59 | 97 | 115 | 86 | 540 |
- Until 2006, the de-facto population is tabulated. The later figures correspond to the usual residents.
- Niue Statistics / PRISM (web).
Population Structure
Further information about the population structure.
| Gender (C 2022) | |
|---|---|
| Males | 813 |
| Females | 876 |
| Age Groups (C 2022) | |
|---|---|
| 0-14 years | 424 |
| 15-64 years | 991 |
| 65+ years | 266 |
| Age Distribution (C 2022) | |
|---|---|
| 80+ years | 57 |
| 70-79 years | 119 |
| 60-69 years | 204 |
| 50-59 years | 193 |
| 40-49 years | 188 |
| 30-39 years | 215 |
| 20-29 years | 153 |
| 10-19 years | 298 |
| 0-9 years | 254 |
