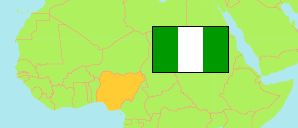
Oyo West
Local Government Area in Nigeria
Contents: Population
The population development of Oyo West as well as related information and services (Wikipedia, Google, images).
| Name | Status | Population Census 1991-11-26 | Population Census 2006-03-21 | Population Projection 2022-03-21 | |
|---|---|---|---|---|---|
| Oyo West | Local Government Area | ... | 136,457 | 195,000 | |
| Nigeria | Federal Republic | 88,992,220 | 140,431,790 | 216,783,400 |
Source: National Population Commission of Nigeria (web), National Bureau of Statistics (web).
Explanation: The population projection assumes the same rate of growth for all LGAs within a state. The undercount of the 1991 census is estimated to be about 25 million. All population figures for Nigeria show high error rates; census results are disputed. Area figures are computed using geospatial data.
Further information about the population structure:
| Gender (C 2006) | |
|---|---|
| Males | 68,897 |
| Females | 67,560 |
| Age Groups (C 2006) | |
|---|---|
| 0-14 years | 52,160 |
| 15-64 years | 79,231 |
| 65+ years | 5,066 |
| Age Distribution (C 2006) | |
|---|---|
| 0-9 years | 35,933 |
| 10-19 years | 31,353 |
| 20-29 years | 25,849 |
| 30-39 years | 17,082 |
| 40-49 years | 11,748 |
| 50-59 years | 6,785 |
| 60-69 years | 4,128 |
| 70-79 years | 2,044 |
| 80+ years | 1,535 |
