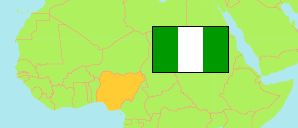
Zamfara
State in Nigeria
Contents: Subdivision
The population development in Zamfara as well as related information and services (Wikipedia, Google, images).
| Name | Status | Population Census 1991-11-26 | Population Census 2006-03-21 | Population Projection 2022-03-21 | |
|---|---|---|---|---|---|
| Zamfara | State | 2,051,591 | 3,278,873 | 5,833,500 | |
| Anka | Local Government Area | ... | 143,637 | 255,500 | → |
| Bakura | Local Government Area | 126,865 | 187,141 | 332,900 | → |
| Birnin Magaji | Local Government Area | ... | 184,083 | 327,500 | → |
| Bukkuyum | Local Government Area | 121,069 | 216,348 | 384,900 | → |
| Bungudu | Local Government Area | 189,783 | 258,644 | 460,200 | → |
| Gummi | Local Government Area | ... | 206,721 | 367,800 | → |
| Gusau | Local Government Area | 259,336 | 383,712 | 682,700 | → |
| Kaura Namoda | Local Government Area | ... | 285,363 | 507,700 | → |
| Maradun | Local Government Area | 131,423 | 207,563 | 369,300 | → |
| Maru | Local Government Area | ... | 293,141 | 521,500 | → |
| Shinkafi | Local Government Area | ... | 135,964 | 241,900 | → |
| Talata Mafara | Local Government Area | 138,844 | 215,650 | 383,700 | → |
| Tsafe | Local Government Area | 163,512 | 266,929 | 474,900 | → |
| Zurmi | Local Government Area | 176,683 | 293,977 | 523,000 | → |
| Nigeria | Federal Republic | 88,992,220 | 140,431,790 | 216,783,400 |
Source: National Population Commission of Nigeria (web), National Bureau of Statistics (web).
Explanation: The population projection assumes the same rate of growth for all LGAs within a state. The undercount of the 1991 census is estimated to be about 25 million. All population figures for Nigeria show high error rates; census results are disputed. Area figures are computed using geospatial data.
Further information about the population structure:
| Gender (C 2006) | |
|---|---|
| Males | 1,641,623 |
| Females | 1,637,250 |
| Age Groups (C 2006) | |
|---|---|
| 0-14 years | 1,572,822 |
| 15-64 years | 1,613,022 |
| 65+ years | 93,029 |
| Age Distribution (C 2006) | |
|---|---|
| 0-9 years | 1,215,042 |
| 10-19 years | 672,714 |
| 20-29 years | 539,415 |
| 30-39 years | 359,844 |
| 40-49 years | 214,693 |
| 50-59 years | 128,463 |
| 60-69 years | 72,771 |
| 70-79 years | 41,511 |
| 80+ years | 34,420 |