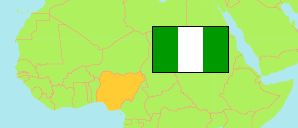
Yobe
State in Nigeria
Contents: Subdivision
The population development in Yobe as well as related information and services (Wikipedia, Google, images).
| Name | Status | Population Census 1991-11-26 | Population Census 2006-03-21 | Population Projection 2022-03-21 | |
|---|---|---|---|---|---|
| Yobe | State | 1,399,687 | 2,321,339 | 3,649,600 | |
| Bade | Local Government Area | 106,206 | 139,804 | 219,800 | → |
| Bursari | Local Government Area | 70,326 | 109,692 | 172,500 | → |
| Damaturu | Local Government Area | ... | 87,706 | 137,900 | → |
| Fika | Local Government Area | 118,918 | 136,736 | 215,000 | → |
| Fune | Local Government Area | 124,817 | 301,954 | 474,700 | → |
| Geidam | Local Government Area | 86,991 | 155,740 | 244,900 | → |
| Gujba | Local Government Area | ... | 129,797 | 204,100 | → |
| Gulani | Local Government Area | ... | 103,516 | 162,700 | → |
| Jakusko | Local Government Area | 80,326 | 232,458 | 365,500 | → |
| Karasuwa | Local Government Area | ... | 105,514 | 165,900 | → |
| Machina | Local Government Area | 44,274 | 60,994 | 95,900 | → |
| Nangere | Local Government Area | ... | 87,517 | 137,600 | → |
| Nguru | Local Government Area | ... | 150,699 | 236,900 | → |
| Potiskum | Local Government Area | ... | 204,866 | 322,100 | → |
| Tarmua | Local Government Area | ... | 77,667 | 122,100 | → |
| Yunusari | Local Government Area | 76,160 | 125,940 | 198,000 | → |
| Yusufari | Local Government Area | ... | 110,739 | 174,100 | → |
| Nigeria | Federal Republic | 88,992,220 | 140,431,790 | 216,783,400 |
Source: National Population Commission of Nigeria (web), National Bureau of Statistics (web).
Explanation: The population projection assumes the same rate of growth for all LGAs within a state. The undercount of the 1991 census is estimated to be about 25 million. All population figures for Nigeria show high error rates; census results are disputed. Area figures are computed using geospatial data.
Further information about the population structure:
| Gender (C 2006) | |
|---|---|
| Males | 1,205,034 |
| Females | 1,116,305 |
| Age Groups (C 2006) | |
|---|---|
| 0-14 years | 1,083,308 |
| 15-64 years | 1,172,398 |
| 65+ years | 65,633 |
| Age Distribution (C 2006) | |
|---|---|
| 0-9 years | 815,066 |
| 10-19 years | 507,562 |
| 20-29 years | 391,180 |
| 30-39 years | 254,443 |
| 40-49 years | 156,591 |
| 50-59 years | 90,401 |
| 60-69 years | 52,323 |
| 70-79 years | 30,646 |
| 80+ years | 23,127 |