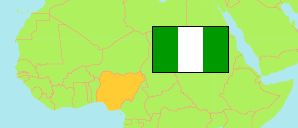
Rivers
State in Nigeria
Contents: Subdivision
The population development in Rivers as well as related information and services (Wikipedia, Google, images).
| Name | Status | Population Census 1991-11-26 | Population Census 2006-03-21 | Population Projection 2022-03-21 | |
|---|---|---|---|---|---|
| Rivers | State | 3,187,844 | 5,198,716 | 7,476,800 | |
| Abua - Odual | Local Government Area | 134,420 | 282,410 | 406,200 | → |
| Ahoada East | Local Government Area | ... | 166,324 | 239,200 | → |
| Ahoada West | Local Government Area | ... | 249,232 | 358,400 | → |
| Akuku Toru | Local Government Area | 102,169 | 161,103 | 231,700 | → |
| Andoni | Local Government Area | ... | 217,924 | 313,400 | → |
| Asari-Toru | Local Government Area | 166,788 | 219,787 | 316,100 | → |
| Bonny | Local Government Area | 76,124 | 214,983 | 309,200 | → |
| Degema | Local Government Area | 95,889 | 249,467 | 358,800 | → |
| Eleme | Local Government Area | ... | 190,194 | 273,500 | → |
| Emuoha | Local Government Area | 154,923 | 201,057 | 289,200 | → |
| Etche | Local Government Area | ... | 249,939 | 359,500 | → |
| Gokana | Local Government Area | 159,461 | 233,813 | 336,300 | → |
| Ikwerre | Local Government Area | 125,385 | 188,930 | 271,700 | → |
| Khana | Local Government Area | 207,095 | 292,924 | 421,300 | → |
| Obio/Akpor | Local Government Area | 263,017 | 462,350 | 665,000 | → |
| Ogba - Egbema - Ndoni | Local Government Area | 190,751 | 283,294 | 407,400 | → |
| Ogu - Bolo | Local Government Area | ... | 75,282 | 108,300 | → |
| Okrika | Local Government Area | ... | 222,285 | 319,700 | → |
| Omumma | Local Government Area | ... | 100,388 | 144,400 | → |
| Opobo - Nkoro | Local Government Area | ... | 152,833 | 219,800 | → |
| Oyigbo | Local Government Area | 85,334 | 125,331 | 180,300 | → |
| Port-Harcourt | Local Government Area | 440,399 | 538,558 | 774,600 | → |
| Tai | Local Government Area | ... | 120,308 | 173,000 | → |
| Nigeria | Federal Republic | 88,992,220 | 140,431,790 | 216,783,400 |
Source: National Population Commission of Nigeria (web), National Bureau of Statistics (web).
Explanation: The population projection assumes the same rate of growth for all LGAs within a state. The undercount of the 1991 census is estimated to be about 25 million. All population figures for Nigeria show high error rates; census results are disputed. Area figures are computed using geospatial data.
Further information about the population structure:
| Gender (C 2006) | |
|---|---|
| Males | 2,673,026 |
| Females | 2,525,690 |
| Age Groups (C 2006) | |
|---|---|
| 0-14 years | 1,871,982 |
| 15-64 years | 3,160,996 |
| 65+ years | 165,738 |
| Age Distribution (C 2006) | |
|---|---|
| 0-9 years | 1,262,446 |
| 10-19 years | 1,214,221 |
| 20-29 years | 1,036,110 |
| 30-39 years | 681,847 |
| 40-49 years | 472,846 |
| 50-59 years | 265,117 |
| 60-69 years | 149,058 |
| 70-79 years | 67,059 |
| 80+ years | 50,012 |
