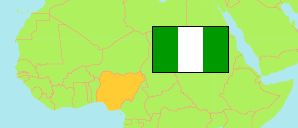
Osun
State in Nigeria
Contents: Subdivision
The population development in Osun as well as related information and services (Wikipedia, Google, images).
| Name | Status | Population Census 1991-11-26 | Population Census 2006-03-21 | Population Projection 2022-03-21 | |
|---|---|---|---|---|---|
| Osun | State | 2,158,143 | 3,416,959 | 4,435,800 | |
| Aiyedaade | Local Government Area | 94,777 | 149,569 | 194,200 | → |
| Aiyedire | Local Government Area | 41,636 | 76,309 | 99,100 | → |
| Atakunmosa East | Local Government Area | ... | 76,105 | 98,800 | → |
| Atakunmosa West | Local Government Area | ... | 68,350 | 88,700 | → |
| Boluwaduro | Local Government Area | ... | 70,954 | 92,100 | → |
| Boripe | Local Government Area | 110,174 | 138,742 | 180,100 | → |
| Ede North | Local Government Area | ... | 83,818 | 108,800 | → |
| Ede South | Local Government Area | ... | 75,489 | 98,000 | → |
| Egbedore | Local Government Area | 40,293 | 73,969 | 96,000 | → |
| Ejigbo | Local Government Area | 69,366 | 132,515 | 172,000 | → |
| Ife Central | Local Government Area | ... | 167,204 | 217,100 | → |
| Ifedayo | Local Government Area | 24,671 | 37,508 | 48,700 | → |
| Ife East | Local Government Area | ... | 188,614 | 244,900 | → |
| Ifelodun | Local Government Area | 76,565 | 96,444 | 125,200 | → |
| Ife North | Local Government Area | 133,258 | 153,274 | 199,000 | → |
| Ife South | Local Government Area | 88,170 | 134,490 | 174,600 | → |
| Ila | Local Government Area | ... | 62,054 | 80,600 | → |
| Ilesha East | Local Government Area | ... | 105,416 | 136,800 | → |
| Ilesha West | Local Government Area | ... | 106,809 | 138,700 | → |
| Irepodun | Local Government Area | ... | 119,590 | 155,200 | → |
| Irewole | Local Government Area | ... | 142,806 | 185,400 | → |
| Isokan | Local Government Area | ... | 102,060 | 132,500 | → |
| Iwo | Local Government Area | 105,401 | 191,348 | 248,400 | → |
| Obokun | Local Government Area | 61,218 | 116,850 | 151,700 | → |
| Odo-Otin | Local Government Area | 82,314 | 132,078 | 171,500 | → |
| Ola-Oluwa | Local Government Area | 39,454 | 76,227 | 99,000 | → |
| Olorunda | Local Government Area | 83,347 | 131,649 | 170,900 | → |
| Oriade | Local Government Area | 80,833 | 148,379 | 192,600 | → |
| Orolu | Local Government Area | ... | 102,832 | 133,500 | → |
| Osogbo | Local Government Area | 106,386 | 155,507 | 201,900 | → |
| Nigeria | Federal Republic | 88,992,220 | 140,431,790 | 216,783,400 |
Source: National Population Commission of Nigeria (web), National Bureau of Statistics (web).
Explanation: The population projection assumes the same rate of growth for all LGAs within a state. The undercount of the 1991 census is estimated to be about 25 million. All population figures for Nigeria show high error rates; census results are disputed. Area figures are computed using geospatial data.
Further information about the population structure:
| Gender (C 2006) | |
|---|---|
| Males | 1,734,149 |
| Females | 1,682,810 |
| Age Groups (C 2006) | |
|---|---|
| 0-14 years | 1,260,698 |
| 15-64 years | 2,027,230 |
| 65+ years | 129,031 |
| Age Distribution (C 2006) | |
|---|---|
| 0-9 years | 846,964 |
| 10-19 years | 810,558 |
| 20-29 years | 649,525 |
| 30-39 years | 412,199 |
| 40-49 years | 309,488 |
| 50-59 years | 186,745 |
| 60-69 years | 110,512 |
| 70-79 years | 53,079 |
| 80+ years | 37,889 |
