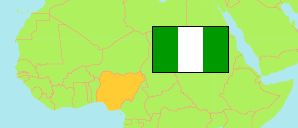
Ondo
State in Nigeria
Contents: Subdivision
The population development in Ondo as well as related information and services (Wikipedia, Google, images).
| Name | Status | Population Census 1991-11-26 | Population Census 2006-03-21 | Population Projection 2022-03-21 | |
|---|---|---|---|---|---|
| Ondo | State | 2,249,548 | 3,460,877 | 5,316,600 | |
| Akoko North East | Local Government Area | ... | 179,092 | 275,100 | → |
| Akoko North West | Local Government Area | 119,278 | 211,867 | 325,500 | → |
| Akoko South East | Local Government Area | ... | 82,443 | 126,600 | → |
| Akoko South West | Local Government Area | ... | 228,383 | 350,800 | → |
| Akure North | Local Government Area | ... | 130,765 | 200,900 | → |
| Akure South | Local Government Area | ... | 360,268 | 553,400 | → |
| Ese-Odo | Local Government Area | ... | 158,256 | 243,100 | → |
| Idanre | Local Government Area | 85,776 | 129,795 | 199,400 | → |
| Ifedore | Local Government Area | 102,617 | 176,372 | 270,900 | → |
| Ilaje | Local Government Area | ... | 289,838 | 445,200 | → |
| Ile-Oluji-Okeigbo | Local Government Area | 116,094 | 171,876 | 264,000 | → |
| Irele | Local Government Area | 100,127 | 144,136 | 221,400 | → |
| Odigbo | Local Government Area | 154,320 | 232,287 | 356,800 | → |
| Okitipupa | Local Government Area | 176,615 | 234,138 | 359,700 | → |
| Ondo East | Local Government Area | ... | 76,092 | 116,900 | → |
| Ondo West | Local Government Area | ... | 288,868 | 443,800 | → |
| Ose | Local Government Area | 93,033 | 144,139 | 221,400 | → |
| Owo | Local Government Area | 157,191 | 222,262 | 341,400 | → |
| Nigeria | Federal Republic | 88,992,220 | 140,431,790 | 216,783,400 |
Source: National Population Commission of Nigeria (web), National Bureau of Statistics (web).
Explanation: The population projection assumes the same rate of growth for all LGAs within a state. The undercount of the 1991 census is estimated to be about 25 million. All population figures for Nigeria show high error rates; census results are disputed. Area figures are computed using geospatial data.
Further information about the population structure:
| Gender (C 2006) | |
|---|---|
| Males | 1,745,057 |
| Females | 1,715,820 |
| Age Groups (C 2006) | |
|---|---|
| 0-14 years | 1,316,507 |
| 15-64 years | 2,015,562 |
| 65+ years | 128,808 |
| Age Distribution (C 2006) | |
|---|---|
| 0-9 years | 896,140 |
| 10-19 years | 811,615 |
| 20-29 years | 640,438 |
| 30-39 years | 427,595 |
| 40-49 years | 305,199 |
| 50-59 years | 178,874 |
| 60-69 years | 108,242 |
| 70-79 years | 52,805 |
| 80+ years | 39,969 |