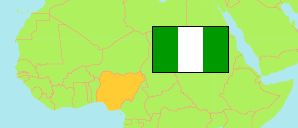
Lagos
State in Nigeria
Contents: Subdivision
The population development in Lagos as well as related information and services (Wikipedia, Google, images).
| Name | Status | Population Census 1991-11-26 | Population Census 2006-03-21 | Population Projection 2022-03-21 | |
|---|---|---|---|---|---|
| Lagos | State | 5,725,116 | 9,113,605 | 13,491,800 | |
| Agege | Local Government Area | 417,981 | 461,743 | 683,600 | → |
| Ajeromi-Ifelodun | Local Government Area | 593,561 | 687,316 | 1,017,500 | → |
| Alimosho | Local Government Area | 430,890 | 1,319,571 | 1,953,500 | → |
| Amuwo-Odofin | Local Government Area | 225,823 | 328,975 | 487,000 | → |
| Apapa | Local Government Area | 154,477 | 222,986 | 330,100 | → |
| Badagry | Local Government Area | 119,267 | 237,731 | 351,900 | → |
| Epe | Local Government Area | 101,464 | 181,734 | 269,000 | → |
| Eti-Osa | Local Government Area | 157,387 | 283,791 | 420,100 | → |
| Ibeju/Lekki | Local Government Area | 24,937 | 117,793 | 174,400 | → |
| Ifako-Ijaye | Local Government Area | 233,341 | 427,737 | 633,200 | → |
| Ikeja | Local Government Area | 203,383 | 317,614 | 470,200 | → |
| Ikorodu | Local Government Area | 184,674 | 527,917 | 781,500 | → |
| Kosofe | Local Government Area | 412,407 | 682,772 | 1,010,800 | → |
| Lagos Island | Local Government Area | 165,996 | 212,700 | 314,900 | → |
| Lagos Mainland | Local Government Area | 273,079 | 326,700 | 483,600 | → |
| Mushin | Local Government Area | 539,783 | 631,857 | 935,400 | → |
| Ojo | Local Government Area | 215,837 | 609,173 | 901,800 | → |
| Oshodi-Isolo | Local Government Area | 449,781 | 629,061 | 931,300 | → |
| Shomolu | Local Government Area | 358,787 | 403,569 | 597,400 | → |
| Surulere | Local Government Area | 462,261 | 502,865 | 744,400 | → |
| Nigeria | Federal Republic | 88,992,220 | 140,431,790 | 216,783,400 |
Source: National Population Commission of Nigeria (web), National Bureau of Statistics (web).
Explanation: The population projection assumes the same rate of growth for all LGAs within a state. The undercount of the 1991 census is estimated to be about 25 million. All population figures for Nigeria show high error rates; census results are disputed. Area figures are computed using geospatial data.
Further information about the population structure:
| Gender (C 2006) | |
|---|---|
| Males | 4,719,125 |
| Females | 4,394,480 |
| Age Groups (C 2006) | |
|---|---|
| 0-14 years | 2,952,614 |
| 15-64 years | 5,952,808 |
| 65+ years | 208,183 |
| Age Distribution (C 2006) | |
|---|---|
| 0-9 years | 2,109,862 |
| 10-19 years | 1,708,267 |
| 20-29 years | 2,212,811 |
| 30-39 years | 1,490,124 |
| 40-49 years | 836,473 |
| 50-59 years | 424,997 |
| 60-69 years | 194,607 |
| 70-79 years | 80,593 |
| 80+ years | 55,871 |
