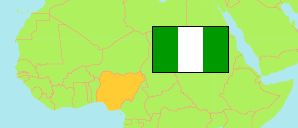
Kebbi
State in Nigeria
Contents: Subdivision
The population development in Kebbi as well as related information and services (Wikipedia, Google, images).
| Name | Status | Population Census 1991-11-26 | Population Census 2006-03-21 | Population Projection 2022-03-21 | |
|---|---|---|---|---|---|
| Kebbi | State | 2,068,490 | 3,256,541 | 5,563,900 | |
| Aleiro | Local Government Area | ... | 67,078 | 114,600 | → |
| Arewa-Dandi | Local Government Area | 137,538 | 189,728 | 324,200 | → |
| Argungu | Local Government Area | ... | 200,248 | 342,100 | → |
| Augie | Local Government Area | ... | 116,368 | 198,800 | → |
| Bagudo | Local Government Area | 153,935 | 238,014 | 406,700 | → |
| Birnin Kebbi | Local Government Area | 150,520 | 268,620 | 458,900 | → |
| Bunza | Local Government Area | ... | 123,547 | 211,100 | → |
| Dandi | Local Government Area | 101,919 | 146,211 | 249,800 | → |
| Fakai | Local Government Area | ... | 119,772 | 204,600 | → |
| Gwandu | Local Government Area | 107,429 | 151,077 | 258,100 | → |
| Jega | Local Government Area | ... | 197,757 | 337,900 | → |
| Kalgo | Local Government Area | ... | 84,928 | 145,100 | → |
| Koko/Besse | Local Government Area | 107,170 | 154,818 | 264,500 | → |
| Maiyama | Local Government Area | 113,072 | 173,759 | 296,900 | → |
| Ngaski | Local Government Area | 68,800 | 126,102 | 215,400 | → |
| Sakaba | Local Government Area | ... | 91,728 | 156,700 | → |
| Shanga | Local Government Area | ... | 127,142 | 217,200 | → |
| Suru | Local Government Area | 116,971 | 148,474 | 253,700 | → |
| Wasagu/Danko | Local Government Area | ... | 265,271 | 453,200 | → |
| Yauri | Local Government Area | ... | 100,564 | 171,800 | → |
| Zuru | Local Government Area | ... | 165,335 | 282,500 | → |
| Nigeria | Federal Republic | 88,992,220 | 140,431,790 | 216,783,400 |
Source: National Population Commission of Nigeria (web), National Bureau of Statistics (web).
Explanation: The population projection assumes the same rate of growth for all LGAs within a state. The undercount of the 1991 census is estimated to be about 25 million. All population figures for Nigeria show high error rates; census results are disputed. Area figures are computed using geospatial data.
Further information about the population structure:
| Gender (C 2006) | |
|---|---|
| Males | 1,631,629 |
| Females | 1,624,912 |
| Age Groups (C 2006) | |
|---|---|
| 0-14 years | 1,577,563 |
| 15-64 years | 1,589,467 |
| 65+ years | 89,511 |
| Age Distribution (C 2006) | |
|---|---|
| 0-9 years | 1,212,121 |
| 10-19 years | 674,966 |
| 20-29 years | 535,353 |
| 30-39 years | 352,210 |
| 40-49 years | 212,890 |
| 50-59 years | 125,300 |
| 60-69 years | 73,377 |
| 70-79 years | 39,771 |
| 80+ years | 30,553 |