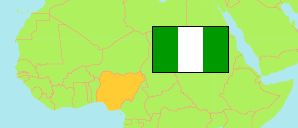
Kaduna
State in Nigeria
Contents: Subdivision
The population development in Kaduna as well as related information and services (Wikipedia, Google, images).
| Name | Status | Population Census 1991-11-26 | Population Census 2006-03-21 | Population Projection 2022-03-21 | |
|---|---|---|---|---|---|
| Kaduna | State | 3,935,618 | 6,113,503 | 9,032,200 | |
| Birnin-Gwari | Local Government Area | 143,072 | 258,581 | 382,000 | → |
| Chikun | Local Government Area | ... | 372,272 | 550,000 | → |
| Giwa | Local Government Area | 171,061 | 292,384 | 432,000 | → |
| Igabi | Local Government Area | 308,239 | 430,753 | 636,400 | → |
| Ikara | Local Government Area | ... | 194,723 | 287,700 | → |
| Jaba | Local Government Area | 66,119 | 155,973 | 230,400 | → |
| Jema'a | Local Government Area | ... | 278,202 | 411,000 | → |
| Kachia | Local Government Area | ... | 252,568 | 373,100 | → |
| Kaduna North | Local Government Area | ... | 364,575 | 538,600 | → |
| Kaduna South | Local Government Area | ... | 402,731 | 595,000 | → |
| Kagarko | Local Government Area | ... | 239,058 | 353,200 | → |
| Kajuru | Local Government Area | ... | 109,810 | 162,200 | → |
| Kaura | Local Government Area | 101,455 | 174,626 | 258,000 | → |
| Kauru | Local Government Area | 116,284 | 221,276 | 326,900 | → |
| Kubau | Local Government Area | ... | 280,704 | 414,700 | → |
| Kudan | Local Government Area | ... | 138,956 | 205,300 | → |
| Lere | Local Government Area | 205,727 | 339,740 | 501,900 | → |
| Makarfi | Local Government Area | ... | 146,574 | 216,600 | → |
| Sabon-Gari | Local Government Area | 224,067 | 291,358 | 430,500 | → |
| Sanga | Local Government Area | ... | 151,485 | 223,800 | → |
| Soba | Local Government Area | 174,217 | 291,173 | 430,200 | → |
| Zangon-Kataf | Local Government Area | 140,224 | 318,991 | 471,300 | → |
| Zaria | Local Government Area | 284,318 | 406,990 | 601,300 | → |
| Nigeria | Federal Republic | 88,992,220 | 140,431,790 | 216,783,400 |
Source: National Population Commission of Nigeria (web), National Bureau of Statistics (web).
Explanation: The population projection assumes the same rate of growth for all LGAs within a state. The undercount of the 1991 census is estimated to be about 25 million. All population figures for Nigeria show high error rates; census results are disputed. Area figures are computed using geospatial data.
Further information about the population structure:
| Gender (C 2006) | |
|---|---|
| Males | 3,090,438 |
| Females | 3,023,065 |
| Age Groups (C 2006) | |
|---|---|
| 0-14 years | 2,820,988 |
| 15-64 years | 3,118,511 |
| 65+ years | 174,004 |
| Age Distribution (C 2006) | |
|---|---|
| 0-9 years | 2,116,824 |
| 10-19 years | 1,333,824 |
| 20-29 years | 1,069,953 |
| 30-39 years | 683,125 |
| 40-49 years | 421,717 |
| 50-59 years | 232,226 |
| 60-69 years | 120,209 |
| 70-79 years | 70,075 |
| 80+ years | 65,550 |
