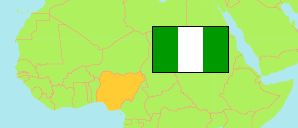
Gombe
State in Nigeria
Contents: Subdivision
The population development in Gombe as well as related information and services (Wikipedia, Google, images).
| Name | Status | Population Census 1991-11-26 | Population Census 2006-03-21 | Population Projection 2022-03-21 | |
|---|---|---|---|---|---|
| Gombe | State | 1,489,120 | 2,365,040 | 3,960,100 | |
| Akko | Local Government Area | 235,592 | 337,435 | 565,000 | → |
| Balanga | Local Government Area | 129,099 | 211,490 | 354,100 | → |
| Billiri | Local Government Area | 86,557 | 202,680 | 339,400 | → |
| Dukku | Local Government Area | 156,825 | 207,658 | 347,700 | → |
| Funakaye | Local Government Area | ... | 237,687 | 398,000 | → |
| Gombe | Local Government Area | ... | 266,844 | 446,800 | → |
| Kaltungo | Local Government Area | ... | 160,392 | 268,600 | → |
| Kwami | Local Government Area | ... | 193,995 | 324,800 | → |
| Nafada | Local Government Area | ... | 140,185 | 234,700 | → |
| Shomgom | Local Government Area | ... | 150,948 | 252,800 | → |
| Yamaltu/Deba | Local Government Area | 221,836 | 255,726 | 428,200 | → |
| Nigeria | Federal Republic | 88,992,220 | 140,431,790 | 216,783,400 |
Source: National Population Commission of Nigeria (web), National Bureau of Statistics (web).
Explanation: The population projection assumes the same rate of growth for all LGAs within a state. The undercount of the 1991 census is estimated to be about 25 million. All population figures for Nigeria show high error rates; census results are disputed. Area figures are computed using geospatial data.
Further information about the population structure:
| Gender (C 2006) | |
|---|---|
| Males | 1,244,228 |
| Females | 1,120,812 |
| Age Groups (C 2006) | |
|---|---|
| 0-14 years | 1,123,896 |
| 15-64 years | 1,177,499 |
| 65+ years | 63,645 |
| Age Distribution (C 2006) | |
|---|---|
| 0-9 years | 834,750 |
| 10-19 years | 545,001 |
| 20-29 years | 398,640 |
| 30-39 years | 250,685 |
| 40-49 years | 154,331 |
| 50-59 years | 84,895 |
| 60-69 years | 47,658 |
| 70-79 years | 28,311 |
| 80+ years | 20,769 |