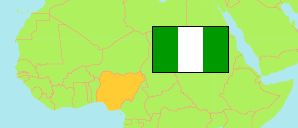
Enugu
State in Nigeria
Contents: Subdivision
The population development in Enugu as well as related information and services (Wikipedia, Google, images).
| Name | Status | Population Census 1991-11-26 | Population Census 2006-03-21 | Population Projection 2022-03-21 | |
|---|---|---|---|---|---|
| Enugu | State | 2,125,068 | 3,267,837 | 4,690,100 | |
| Aninri | Local Government Area | ... | 136,221 | 195,500 | → |
| Awgu | Local Government Area | ... | 197,292 | 283,200 | → |
| Enugu East | Local Government Area | ... | 277,119 | 397,700 | → |
| Enugu North | Local Government Area | ... | 242,140 | 347,500 | → |
| Enugu South | Local Government Area | 137,050 | 198,032 | 284,200 | → |
| Ezeagu | Local Government Area | 112,754 | 170,603 | 244,900 | → |
| Igbo-Etiti | Local Government Area | 138,401 | 208,333 | 299,000 | → |
| Igbo-Eze North | Local Government Area | 139,290 | 258,829 | 371,500 | → |
| Igbo-Eze South | Local Government Area | 75,641 | 147,364 | 211,500 | → |
| Isi-Uzo | Local Government Area | ... | 148,597 | 213,300 | → |
| Nkanu East | Local Government Area | ... | 153,591 | 220,400 | → |
| Nkanu West | Local Government Area | ... | 147,385 | 211,500 | → |
| Nsukka | Local Government Area | 220,411 | 309,448 | 444,100 | → |
| Oji-River | Local Government Area | 86,361 | 128,741 | 184,800 | → |
| Udenu | Local Government Area | ... | 178,687 | 256,500 | → |
| Udi | Local Government Area | 160,500 | 238,305 | 342,000 | → |
| Uzo-Uwani | Local Government Area | 88,112 | 127,150 | 182,500 | → |
| Nigeria | Federal Republic | 88,992,220 | 140,431,790 | 216,783,400 |
Source: National Population Commission of Nigeria (web), National Bureau of Statistics (web).
Explanation: The population projection assumes the same rate of growth for all LGAs within a state. The undercount of the 1991 census is estimated to be about 25 million. All population figures for Nigeria show high error rates; census results are disputed. Area figures are computed using geospatial data.
Further information about the population structure:
| Gender (C 2006) | |
|---|---|
| Males | 1,596,042 |
| Females | 1,671,795 |
| Age Groups (C 2006) | |
|---|---|
| 0-14 years | 1,163,114 |
| 15-64 years | 1,958,051 |
| 65+ years | 146,672 |
| Age Distribution (C 2006) | |
|---|---|
| 0-9 years | 772,569 |
| 10-19 years | 777,518 |
| 20-29 years | 622,267 |
| 30-39 years | 375,479 |
| 40-49 years | 301,070 |
| 50-59 years | 194,028 |
| 60-69 years | 123,043 |
| 70-79 years | 62,797 |
| 80+ years | 39,066 |