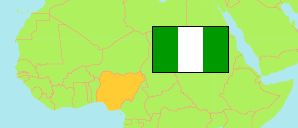
Edo
State in Nigeria
Contents: Subdivision
The population development in Edo as well as related information and services (Wikipedia, Google, images).
| Name | Status | Population Census 1991-11-26 | Population Census 2006-03-21 | Population Projection 2022-03-21 | |
|---|---|---|---|---|---|
| Edo | State | 2,172,005 | 3,233,366 | 4,777,000 | |
| Akoko-Edo | Local Government Area | 123,686 | 261,567 | 386,400 | → |
| Egor | Local Government Area | ... | 340,287 | 502,700 | → |
| Esan Central | Local Government Area | ... | 105,242 | 155,500 | → |
| Esan North East | Local Government Area | 88,687 | 121,989 | 180,200 | → |
| Esan South East | Local Government Area | 83,643 | 166,309 | 245,700 | → |
| Esan West | Local Government Area | 89,628 | 127,718 | 188,700 | → |
| Etsako Central | Local Government Area | ... | 94,228 | 139,200 | → |
| Etsako East | Local Government Area | ... | 147,335 | 217,700 | → |
| Etsako West | Local Government Area | 126,112 | 198,975 | 294,000 | → |
| Igueben | Local Government Area | ... | 70,276 | 103,800 | → |
| Ikpoba-Okha | Local Government Area | ... | 372,080 | 549,700 | → |
| Oredo | Local Government Area | ... | 374,515 | 553,300 | → |
| Orhionmwon | Local Government Area | 147,537 | 183,994 | 271,800 | → |
| Ovia North East | Local Government Area | 121,769 | 155,344 | 229,500 | → |
| Ovia South West | Local Government Area | 80,692 | 138,072 | 204,000 | → |
| Owan East | Local Government Area | 90,927 | 154,630 | 228,500 | → |
| Owan West | Local Government Area | 70,374 | 99,056 | 146,300 | → |
| Uhunmwonde | Local Government Area | 98,767 | 121,749 | 179,900 | → |
| Nigeria | Federal Republic | 88,992,220 | 140,431,790 | 216,783,400 |
Source: National Population Commission of Nigeria (web), National Bureau of Statistics (web).
Explanation: The population projection assumes the same rate of growth for all LGAs within a state. The undercount of the 1991 census is estimated to be about 25 million. All population figures for Nigeria show high error rates; census results are disputed. Area figures are computed using geospatial data.
Further information about the population structure:
| Gender (C 2006) | |
|---|---|
| Males | 1,633,946 |
| Females | 1,599,420 |
| Age Groups (C 2006) | |
|---|---|
| 0-14 years | 1,180,646 |
| 15-64 years | 1,918,483 |
| 65+ years | 134,237 |
| Age Distribution (C 2006) | |
|---|---|
| 0-9 years | 808,567 |
| 10-19 years | 734,492 |
| 20-29 years | 657,951 |
| 30-39 years | 393,516 |
| 40-49 years | 273,678 |
| 50-59 years | 170,906 |
| 60-69 years | 96,981 |
| 70-79 years | 54,281 |
| 80+ years | 42,994 |
