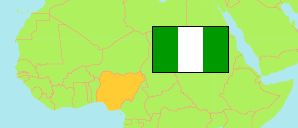
Ebonyi
State in Nigeria
Contents: Subdivision
The population development in Ebonyi as well as related information and services (Wikipedia, Google, images).
| Name | Status | Population Census 1991-11-26 | Population Census 2006-03-21 | Population Projection 2022-03-21 | |
|---|---|---|---|---|---|
| Ebonyi | State | 1,029,312 | 2,176,947 | 3,242,500 | |
| Abakaliki | Local Government Area | ... | 149,683 | 223,000 | → |
| Afikpo North | Local Government Area | 107,633 | 156,649 | 233,300 | → |
| Afikpo South | Local Government Area | 69,725 | 157,542 | 234,700 | → |
| Ebonyi | Local Government Area | ... | 127,226 | 189,500 | → |
| Ezza North | Local Government Area | ... | 146,149 | 217,700 | → |
| Ezza South | Local Government Area | ... | 133,625 | 199,000 | → |
| Ikwo | Local Government Area | 154,396 | 214,969 | 320,200 | → |
| Ishielu | Local Government Area | 128,720 | 152,581 | 227,300 | → |
| Ivo | Local Government Area | ... | 121,363 | 180,800 | → |
| Izzi | Local Government Area | 161,349 | 236,679 | 352,500 | → |
| Ohaozara | Local Government Area | ... | 148,317 | 220,900 | → |
| Ohaukwu | Local Government Area | 169,622 | 195,555 | 291,300 | → |
| Onicha | Local Government Area | 111,965 | 236,609 | 352,400 | → |
| Nigeria | Federal Republic | 88,992,220 | 140,431,790 | 216,783,400 |
Source: National Population Commission of Nigeria (web), National Bureau of Statistics (web).
Explanation: The population projection assumes the same rate of growth for all LGAs within a state. The undercount of the 1991 census is estimated to be about 25 million. All population figures for Nigeria show high error rates; census results are disputed. Area figures are computed using geospatial data.
Further information about the population structure:
| Gender (C 2006) | |
|---|---|
| Males | 1,064,156 |
| Females | 1,112,791 |
| Age Groups (C 2006) | |
|---|---|
| 0-14 years | 901,833 |
| 15-64 years | 1,197,508 |
| 65+ years | 77,606 |
| Age Distribution (C 2006) | |
|---|---|
| 0-9 years | 634,135 |
| 10-19 years | 519,260 |
| 20-29 years | 366,750 |
| 30-39 years | 244,641 |
| 40-49 years | 184,363 |
| 50-59 years | 106,144 |
| 60-69 years | 65,953 |
| 70-79 years | 31,948 |
| 80+ years | 23,753 |