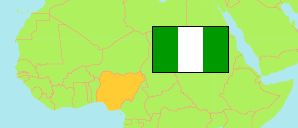
Cross River
State in Nigeria
Contents: Subdivision
The population development in Cross River as well as related information and services (Wikipedia, Google, images).
| Name | Status | Population Census 1991-11-26 | Population Census 2006-03-21 | Population Projection 2022-03-21 | |
|---|---|---|---|---|---|
| Cross River | State | 1,911,297 | 2,892,988 | 4,406,200 | |
| Abi | Local Government Area | ... | 144,317 | 219,800 | → |
| Akamkpa | Local Government Area | 118,472 | 149,705 | 228,000 | → |
| Akpabuyo | Local Government Area | 103,952 | 272,262 | 414,700 | → |
| Bakassi [→ Cameroon (2008)] | Local Government Area | ... | 31,641 | 48,200 | → |
| Bekwara | Local Government Area | ... | 105,497 | 160,700 | → |
| Biase | Local Government Area | 101,121 | 168,113 | 256,000 | → |
| Boki | Local Government Area | 145,010 | 186,611 | 284,200 | → |
| Calabar Municipal | Local Government Area | ... | 183,681 | 279,800 | → |
| Calabar South | Local Government Area | ... | 191,515 | 291,700 | → |
| Etung | Local Government Area | ... | 80,036 | 121,900 | → |
| Ikom | Local Government Area | ... | 163,691 | 249,300 | → |
| Obanliku | Local Government Area | 48,611 | 109,633 | 167,000 | → |
| Obubra | Local Government Area | 134,225 | 172,543 | 262,800 | → |
| Obudu | Local Government Area | 84,799 | 161,457 | 245,900 | → |
| Odukpani | Local Government Area | 122,352 | 192,884 | 293,800 | → |
| Ogoja | Local Government Area | ... | 171,574 | 261,300 | → |
| Yakurr | Local Government Area | ... | 196,271 | 298,900 | → |
| Yala | Local Government Area | 156,627 | 211,557 | 322,200 | → |
| Nigeria | Federal Republic | 88,992,220 | 140,431,790 | 216,783,400 |
Source: National Population Commission of Nigeria (web), National Bureau of Statistics (web).
Explanation: The population projection assumes the same rate of growth for all LGAs within a state. The undercount of the 1991 census is estimated to be about 25 million. All population figures for Nigeria show high error rates; census results are disputed. Area figures are computed using geospatial data.
Further information about the population structure:
| Gender (C 2006) | |
|---|---|
| Males | 1,471,967 |
| Females | 1,421,021 |
| Age Groups (C 2006) | |
|---|---|
| 0-14 years | 1,105,270 |
| 15-64 years | 1,697,035 |
| 65+ years | 90,683 |
| Age Distribution (C 2006) | |
|---|---|
| 0-9 years | 758,791 |
| 10-19 years | 679,784 |
| 20-29 years | 553,631 |
| 30-39 years | 357,611 |
| 40-49 years | 254,441 |
| 50-59 years | 142,255 |
| 60-69 years | 82,052 |
| 70-79 years | 38,278 |
| 80+ years | 26,145 |