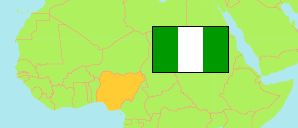
Anambra
State in Nigeria
Contents: Subdivision
The population development in Anambra as well as related information and services (Wikipedia, Google, images).
| Name | Status | Population Census 1991-11-26 | Population Census 2006-03-21 | Population Projection 2022-03-21 | |
|---|---|---|---|---|---|
| Anambra | State | 2,796,475 | 4,177,828 | 5,953,500 | |
| Aguata | Local Government Area | 286,897 | 369,972 | 527,200 | → |
| Anambra East | Local Government Area | ... | 152,149 | 216,800 | → |
| Anambra West | Local Government Area | ... | 167,303 | 238,400 | → |
| Anaocha | Local Government Area | 200,607 | 284,215 | 405,000 | → |
| Awka North | Local Government Area | 60,728 | 112,192 | 159,900 | → |
| Awka South | Local Government Area | 130,664 | 189,654 | 270,300 | → |
| Ayamelum | Local Government Area | ... | 158,152 | 225,400 | → |
| Dunukofia | Local Government Area | ... | 96,517 | 137,500 | → |
| Ekwusigo | Local Government Area | ... | 158,429 | 225,800 | → |
| Idemili North | Local Government Area | ... | 431,005 | 614,200 | → |
| Idemili South | Local Government Area | ... | 206,816 | 294,700 | → |
| Ihiala | Local Government Area | 188,060 | 302,277 | 430,800 | → |
| Njikoka | Local Government Area | ... | 148,394 | 211,500 | → |
| Nnewi North | Local Government Area | ... | 155,443 | 221,500 | → |
| Nnewi South | Local Government Area | 147,428 | 233,362 | 332,500 | → |
| Ogbaru | Local Government Area | 191,761 | 223,317 | 318,200 | → |
| Onitsha North | Local Government Area | 121,157 | 125,918 | 179,400 | → |
| Onitsha South | Local Government Area | 92,716 | 137,191 | 195,500 | → |
| Orumba North | Local Government Area | 127,476 | 172,773 | 246,200 | → |
| Orumba South | Local Government Area | 92,716 | 184,548 | 263,000 | → |
| Oyi | Local Government Area | ... | 168,201 | 239,700 | → |
| Nigeria | Federal Republic | 88,992,220 | 140,431,790 | 216,783,400 |
Source: National Population Commission of Nigeria (web), National Bureau of Statistics (web).
Explanation: The population projection assumes the same rate of growth for all LGAs within a state. The undercount of the 1991 census is estimated to be about 25 million. All population figures for Nigeria show high error rates; census results are disputed. Area figures are computed using geospatial data.
Further information about the population structure:
| Gender (C 2006) | |
|---|---|
| Males | 2,117,984 |
| Females | 2,059,844 |
| Age Groups (C 2006) | |
|---|---|
| 0-14 years | 1,485,567 |
| 15-64 years | 2,526,062 |
| 65+ years | 166,199 |
| Age Distribution (C 2006) | |
|---|---|
| 0-9 years | 978,317 |
| 10-19 years | 1,009,030 |
| 20-29 years | 805,857 |
| 30-39 years | 517,701 |
| 40-49 years | 383,402 |
| 50-59 years | 231,636 |
| 60-69 years | 134,058 |
| 70-79 years | 70,495 |
| 80+ years | 47,332 |