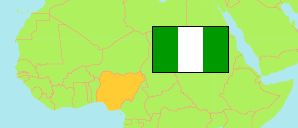
Adamawa
State in Nigeria
Contents: Subdivision
The population development in Adamawa as well as related information and services (Wikipedia, Google, images).
| Name | Status | Population Census 1991-11-26 | Population Census 2006-03-21 | Population Projection 2022-03-21 | |
|---|---|---|---|---|---|
| Adamawa | State | 2,102,053 | 3,178,950 | 4,902,100 | |
| Demsa | Local Government Area | 95,149 | 178,407 | 275,100 | → |
| Fufore | Local Government Area | 158,137 | 209,460 | 323,000 | → |
| Ganye | Local Government Area | ... | 169,948 | 262,100 | → |
| Girei | Local Government Area | ... | 129,855 | 200,200 | → |
| Gombi | Local Government Area | 88,635 | 147,787 | 227,900 | → |
| Guyuk | Local Government Area | 70,526 | 176,505 | 272,200 | → |
| Hong | Local Government Area | 117,240 | 169,183 | 260,900 | → |
| Jada | Local Government Area | 124,856 | 168,445 | 259,700 | → |
| Lamurde | Local Government Area | ... | 111,254 | 171,600 | → |
| Madagali | Local Government Area | 90,159 | 135,142 | 208,400 | → |
| Maiha | Local Government Area | 83,192 | 110,175 | 169,900 | → |
| Mayo-Belwa | Local Government Area | 125,073 | 152,803 | 235,600 | → |
| Michika | Local Government Area | 117,684 | 155,238 | 239,400 | → |
| Mubi North | Local Government Area | ... | 151,515 | 233,600 | → |
| Mubi South | Local Government Area | ... | 129,956 | 200,400 | → |
| Numan | Local Government Area | ... | 91,549 | 141,200 | → |
| Shelleng | Local Government Area | 52,477 | 148,490 | 229,000 | → |
| Song | Local Government Area | ... | 195,188 | 301,000 | → |
| Toungo | Local Government Area | ... | 52,179 | 80,500 | → |
| Yola North | Local Government Area | ... | 199,674 | 307,900 | → |
| Yola South | Local Government Area | ... | 196,197 | 302,500 | → |
| Nigeria | Federal Republic | 88,992,220 | 140,431,790 | 216,783,400 |
Source: National Population Commission of Nigeria (web), National Bureau of Statistics (web).
Explanation: The population projection assumes the same rate of growth for all LGAs within a state. The undercount of the 1991 census is estimated to be about 25 million. All population figures for Nigeria show high error rates; census results are disputed. Area figures are computed using geospatial data.
Further information about the population structure:
| Gender (C 2006) | |
|---|---|
| Males | 1,607,270 |
| Females | 1,571,680 |
| Age Groups (C 2006) | |
|---|---|
| 0-14 years | 1,418,849 |
| 15-64 years | 1,649,546 |
| 65+ years | 110,555 |
| Age Distribution (C 2006) | |
|---|---|
| 0-9 years | 1,047,881 |
| 10-19 years | 699,403 |
| 20-29 years | 552,300 |
| 30-39 years | 356,711 |
| 40-49 years | 228,357 |
| 50-59 years | 131,785 |
| 60-69 years | 78,246 |
| 70-79 years | 48,482 |
| 80+ years | 35,785 |
