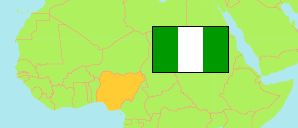
Abia
State in Nigeria
Contents: Subdivision
The population development in Abia as well as related information and services (Wikipedia, Google, images).
| Name | Status | Population Census 1991-11-26 | Population Census 2006-03-21 | Population Projection 2022-03-21 | |
|---|---|---|---|---|---|
| Abia | State | 2,338,487 | 2,845,380 | 4,143,100 | |
| Aba North | Local Government Area | 86,331 | 106,844 | 155,600 | → |
| Aba South | Local Government Area | 413,852 | 427,421 | 622,400 | → |
| Arochukwu | Local Government Area | 97,800 | 169,339 | 246,600 | → |
| Bende | Local Government Area | 132,271 | 192,621 | 280,500 | → |
| Ikwuano | Local Government Area | 52,214 | 137,897 | 200,800 | → |
| Isiala-Ngwa North | Local Government Area | ... | 154,083 | 224,400 | → |
| Isiala-Ngwa South | Local Government Area | 98,575 | 136,650 | 199,000 | → |
| Isuikwuato | Local Government Area | ... | 115,794 | 168,600 | → |
| Obi Ngwa | Local Government Area | ... | 181,894 | 264,900 | → |
| Ohafia | Local Government Area | 148,985 | 245,987 | 358,200 | → |
| Osisioma Ngwa | Local Government Area | ... | 220,662 | 321,300 | → |
| Ugwunagbo | Local Government Area | ... | 85,371 | 124,300 | → |
| Ukwa East | Local Government Area | 32,444 | 58,139 | 84,700 | → |
| Ukwa West | Local Government Area | ... | 87,367 | 127,200 | → |
| Umuahia North | Local Government Area | ... | 223,134 | 324,900 | → |
| Umuahia South | Local Government Area | ... | 139,058 | 202,500 | → |
| Umu-Nneochi | Local Government Area | ... | 163,119 | 237,500 | → |
| Nigeria | Federal Republic | 88,992,220 | 140,431,790 | 216,783,400 |
Source: National Population Commission of Nigeria (web), National Bureau of Statistics (web).
Explanation: The population projection assumes the same rate of growth for all LGAs within a state. The undercount of the 1991 census is estimated to be about 25 million. All population figures for Nigeria show high error rates; census results are disputed. Area figures are computed using geospatial data.
Further information about the population structure:
| Gender (C 2006) | |
|---|---|
| Males | 1,430,298 |
| Females | 1,415,082 |
| Age Groups (C 2006) | |
|---|---|
| 0-14 years | 1,008,008 |
| 15-64 years | 1,709,491 |
| 65+ years | 127,881 |
| Age Distribution (C 2006) | |
|---|---|
| 0-9 years | 662,276 |
| 10-19 years | 687,918 |
| 20-29 years | 537,046 |
| 30-39 years | 348,674 |
| 40-49 years | 259,513 |
| 50-59 years | 161,938 |
| 60-69 years | 95,331 |
| 70-79 years | 53,576 |
| 80+ years | 39,108 |