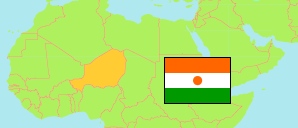
Mirriah
Department in Niger
Contents: Subdivision
The population development in Mirriah as well as related information and services (Wikipedia, Google, images).
| Name | Status | Population Census 2001-05-20 | Population Census 2012-12-10 | |
|---|---|---|---|---|
| Mirriah | Department | 289,594 | 507,499 | |
| Dogo | Commune | 61,551 | 113,447 | → |
| Droum | Commune | 55,078 | 102,306 | → |
| Gaffati | Commune | 30,733 | 46,379 | → |
| Gouna | Commune | 39,700 | 63,598 | → |
| Hamdara | Commune | 22,824 | 39,574 | → |
| Kolléram | Commune | 18,526 | 29,583 | → |
| Mirriah | Commune | 43,364 | 80,126 | → |
| Zermou | Commune | 17,818 | 32,486 | → |
| Niger | Republic | 11,060,291 | 17,138,707 |
Source: Institut National de la Statistique du Niger (web).
Explanation: Area figures are computed by using geospatial data.