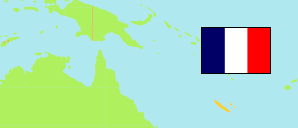
Sud
Province in New Caledonia
Contents: Subdivision
The population development in Sud as well as related information and services (Wikipedia, Google, images).
| Name | Status | Population Census 1976-04-23 | Population Census 1983-04-14 | Population Census 1989-04-04 | Population Census 1996-04-16 | Population Census 2004-08-31 | Population Census 2009-07-27 | Population Census 2014-08-26 | Population Census 2019-09-10 | Population Census 2025-04-22 | |
|---|---|---|---|---|---|---|---|---|---|---|---|
| Sud [South] | Province | 86,694 | 98,548 | 111,653 | 134,546 | 164,235 | 183,007 | 199,983 | 203,144 | 194,978 | |
| Boulouparis (Bouloupari) | Commune | 925 | 1,139 | 1,456 | 1,591 | 2,089 | 2,418 | 3,005 | 3,315 | 3,359 | → |
| Bourail | Commune | 3,149 | 3,410 | 4,122 | 4,364 | 4,779 | 4,999 | 5,444 | 5,531 | 5,575 | → |
| Dumbéa | Commune | 4,191 | 5,538 | 10,052 | 13,888 | 18,602 | 24,103 | 31,812 | 35,873 | 34,926 | → |
| Farino | Commune | 194 | 253 | 237 | 279 | 459 | 598 | 612 | 712 | 736 | → |
| La Foa | Commune | 1,993 | 2,094 | 2,155 | 2,502 | 2,903 | 3,323 | 3,542 | 3,552 | 3,449 | → |
| Le Mont-Dore | Commune | 10,659 | 14,614 | 16,370 | 20,780 | 24,195 | 25,683 | 27,155 | 27,620 | 25,303 | → |
| L'Île-des-Pins | Commune | 1,095 | 1,287 | 1,465 | 1,671 | 1,840 | 1,969 | 1,958 | 2,037 | 2,050 | → |
| Moindou | Commune | 387 | 378 | 461 | 568 | 602 | 704 | 709 | 681 | 944 | → |
| Nouméa | Commune | 56,078 | 60,112 | 65,110 | 76,293 | 91,386 | 97,579 | 99,926 | 94,285 | 85,976 | → |
| Païta | Commune | 3,407 | 4,834 | 6,049 | 7,862 | 12,062 | 16,358 | 20,616 | 24,563 | 27,609 | → |
| Poya | Commune (part) | ... | ... | ... | 94 | 122 | 127 | 230 | 212 | 301 | → |
| Sarraméa | Commune | 357 | 483 | 400 | 486 | 610 | 636 | 584 | 572 | 581 | → |
| Thio | Commune | 2,894 | 3,019 | 2,368 | 2,614 | 2,743 | 2,629 | 2,643 | 2,524 | 2,581 | → |
| Yaté | Commune | 1,365 | 1,387 | 1,408 | 1,554 | 1,843 | 1,881 | 1,747 | 1,667 | 1,588 | → |
| Nouvelle-Calédonie [New Caledonia] | Special Overseas Collectivity | 133,233 | 145,368 | 164,173 | 196,836 | 230,789 | 245,580 | 268,767 | 271,407 | 264,596 |
Source: Institut National de la Statistique et des Études Économiques France, Institut de la Statistique et des Études Économiques Nouvelle-Calédonie.
Further information about the population structure:
| Gender (C 2019) | |
|---|---|
| Males | 100,455 |
| Females | 102,689 |
| Age Distribution (C 2019) | |
|---|---|
| 0-9 years | 28,705 |
| 10-19 years | 31,179 |
| 20-29 years | 27,159 |
| 30-39 years | 30,325 |
| 40-49 years | 29,663 |
| 50-59 years | 25,200 |
| 60-69 years | 16,083 |
| 70-79 years | 10,129 |
| 80+ years | 4,701 |
| Citizenship (C 2019) | |
|---|---|
| France | 198,875 |
| Foreign Citizenship | 4,269 |
| Country of Birth (C 2019) | |
|---|---|
| New Caledonia | 147,339 |
| France | 35,322 |
| Wallis and Futuna | 9,754 |
| Other country | 10,729 |
| Community (C 2019) | |
|---|---|
| Kanak | 58,476 |
| European | 60,302 |
| Wallis and Futuna | 21,982 |
| Mixed | 25,447 |
| Other / Unknown | 36,937 |