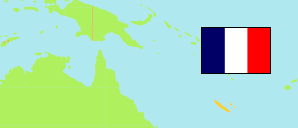
Nord
Province in New Caledonia
Contents: Subdivision
The population development in Nord as well as related information and services (Wikipedia, Google, images).
| Name | Status | Population Census 1976-04-23 | Population Census 1983-04-14 | Population Census 1989-04-04 | Population Census 1996-04-16 | Population Census 2004-08-31 | Population Census 2009-07-27 | Population Census 2014-08-26 | Population Census 2019-09-10 | Population Census 2025-04-22 | |
|---|---|---|---|---|---|---|---|---|---|---|---|
| Nord [North] | Province | 32,021 | 31,310 | 34,608 | 41,413 | 44,474 | 45,137 | 50,487 | 49,910 | 50,947 | |
| Bélep | Commune | 624 | 686 | 745 | 923 | 930 | 895 | 843 | 867 | 686 | → |
| Canala | Commune | ... | ... | 2,907 | 3,374 | 3,512 | 3,341 | 3,687 | 3,701 | 3,911 | → |
| Hienghène | Commune | 1,932 | 1,729 | 2,122 | 2,208 | 2,627 | 2,399 | 2,483 | 2,454 | 2,455 | → |
| Houaïlou | Commune | 3,853 | 3,995 | 3,671 | 4,332 | 4,537 | 3,945 | 4,240 | 3,955 | 3,756 | → |
| Kaala-Gomen | Commune | 1,425 | 1,231 | 1,549 | 1,787 | 1,881 | 1,931 | 2,033 | 1,803 | 2,112 | → |
| Koné | Commune | 2,479 | 2,919 | 2,919 | 4,088 | 4,500 | 5,199 | 7,340 | 8,144 | 8,048 | → |
| Kouaoua | Commune | ... | ... | 1,059 | 1,524 | 1,586 | 1,345 | 1,452 | 1,304 | 1,335 | → |
| Koumac | Commune | ... | 1,405 | 2,194 | 2,647 | 3,003 | 3,690 | 4,252 | 3,981 | 4,272 | → |
| Ouégoa | Commune | 1,514 | 1,468 | 1,881 | 2,034 | 2,114 | 2,132 | 2,360 | 2,118 | 2,409 | → |
| Poindimié | Commune | 3,010 | 3,644 | 3,590 | 4,340 | 4,824 | 4,818 | 4,868 | 5,006 | 4,613 | → |
| Ponérihouen | Commune | 2,065 | 1,932 | 2,326 | 2,691 | 2,726 | 2,384 | 2,370 | 2,420 | 2,332 | → |
| Pouébo | Commune | 1,782 | 1,503 | 2,242 | 2,352 | 2,381 | 2,416 | 2,452 | 2,144 | 2,292 | → |
| Pouembout | Commune | 734 | 692 | 854 | 1,189 | 1,471 | 2,078 | 2,591 | 2,752 | 3,062 | → |
| Poum | Commune | ... | 816 | 1,038 | 1,320 | 1,390 | 1,388 | 1,463 | 1,435 | 1,597 | → |
| Poya | Commune (part) | 2,915 | 1,961 | 1,862 | 2,428 | 2,478 | 2,521 | 2,806 | 2,590 | 2,661 | → |
| Touho | Commune | 1,667 | 1,901 | 1,963 | 2,234 | 2,274 | 2,247 | 2,087 | 2,380 | 2,284 | → |
| Voh | Commune | 1,656 | 1,586 | 1,686 | 1,942 | 2,240 | 2,408 | 3,160 | 2,856 | 3,122 | → |
| Nouvelle-Calédonie [New Caledonia] | Special Overseas Collectivity | 133,233 | 145,368 | 164,173 | 196,836 | 230,789 | 245,580 | 268,767 | 271,407 | 264,596 |
Source: Institut National de la Statistique et des Études Économiques France, Institut de la Statistique et des Études Économiques Nouvelle-Calédonie.
Further information about the population structure:
| Gender (C 2019) | |
|---|---|
| Males | 25,862 |
| Females | 24,048 |
| Age Distribution (C 2019) | |
|---|---|
| 0-9 years | 8,043 |
| 10-19 years | 7,638 |
| 20-29 years | 8,164 |
| 30-39 years | 7,865 |
| 40-49 years | 6,954 |
| 50-59 years | 5,477 |
| 60-69 years | 3,374 |
| 70-79 years | 1,745 |
| 80+ years | 650 |
| Citizenship (C 2019) | |
|---|---|
| France | 49,581 |
| Foreign Citizenship | 329 |
| Country of Birth (C 2019) | |
|---|---|
| New Caledonia | 46,175 |
| France | 2,639 |
| Wallis and Futuna | 494 |
| Other country | 602 |
| Community (C 2019) | |
|---|---|
| Kanak | 36,013 |
| European | 4,867 |
| Wallis and Futuna | 524 |
| Mixed | 4,944 |
| Other / Unknown | 3,562 |