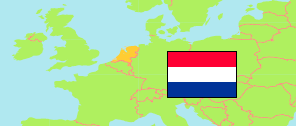
Heerlen
Municipality in Limburg (Netherlands)
Contents: Population
The population development of Heerlen as well as related information and services (Wikipedia, Google, images).
| Name | Status | Population Census 2001-01-01 | Population Estimate 2008-01-01 | Population Estimate 2011-01-01 | Population Estimate 2018-01-01 | Population Estimate 2024-01-01 | |
|---|---|---|---|---|---|---|---|
| Heerlen | Municipality | 95,149 | 89,671 | 89,212 | 86,762 | 87,498 | |
| Nederland [Netherlands] | Country | 15,985,538 | 16,405,399 | 16,655,799 | 17,181,084 | 17,947,684 |
Source: Statistics Netherlands.
Explanation: Provinces and municipalities in the boundaries of 1 January 2024. 2024 population figures are preliminary.
Further information about the population structure:
| Gender (E 2023) | |
|---|---|
| Males | 43,456 |
| Females | 43,666 |
| Age Groups (E 2023) | |
|---|---|
| 0-17 years | 13,591 |
| 18-64 years | 52,519 |
| 65+ years | 21,012 |
| Age Distribution (E 2023) | |
|---|---|
| 90+ years | 891 |
| 80-89 years | 4,549 |
| 70-79 years | 9,416 |
| 60-69 years | 13,022 |
| 50-59 years | 13,087 |
| 40-49 years | 9,976 |
| 30-39 years | 10,782 |
| 20-29 years | 10,070 |
| 10-19 years | 8,005 |
| 0-9 years | 7,324 |
| Urbanization (E 2023) | |
|---|---|
| Highly urbanized | 9,480 |
| Strongly urbanized | 52,870 |
| Moderately urbanized | 18,000 |
| Lowly urbanized | 6,120 |
| Rural | 650 |
| Citizenhip (E 2023) | |
|---|---|
| Netherlands | 81,008 |
| European Union | 3,506 |
| Europe (Rest) | 482 |
| Other country | 2,126 |
| Birth Country (E 2023) | |
|---|---|
| Netherlands | 73,509 |
| Other country | 13,613 |