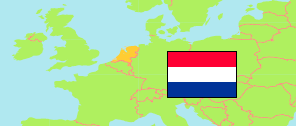
Limburg
Province in Netherlands
Contents: Subdivision
The population development in Limburg as well as related information and services (Wikipedia, Google, images).
| Name | Status | Population Census 2001-01-01 | Population Estimate 2008-01-01 | Population Estimate 2011-01-01 | Population Estimate 2018-01-01 | Population Estimate 2024-01-01 | |
|---|---|---|---|---|---|---|---|
| Limburg | Province | 1,142,584 | 1,123,705 | 1,122,627 | 1,117,198 | 1,133,174 | |
| Beekdaelen (incl. Nuth, Onderbanken, Schinnen) | Municipality | 38,810 | 37,509 | 37,019 | 35,969 | 35,892 | → |
| Beek (L.) | Municipality | 17,174 | 16,696 | 16,548 | 15,895 | 16,216 | → |
| Beesel | Municipality | 13,188 | 13,643 | 13,844 | 13,444 | 13,393 | → |
| Bergen (L.) | Municipality | 13,444 | 13,499 | 13,350 | 13,106 | 13,151 | → |
| Brunssum | Municipality | 30,395 | 29,742 | 29,375 | 28,241 | 27,773 | → |
| Echt-Susteren | Municipality | 32,269 | 32,172 | 32,264 | 31,751 | 32,037 | → |
| Eijsden-Margraten | Municipality | 25,814 | 25,026 | 24,940 | 25,566 | 26,034 | → |
| Gennep | Municipality | 16,822 | 16,890 | 17,383 | 17,052 | 17,790 | → |
| Gulpen-Wittem | Municipality | 15,525 | 14,712 | 14,496 | 14,196 | 14,056 | → |
| Heerlen | Municipality | 95,149 | 89,671 | 89,212 | 86,762 | 87,498 | → |
| Horst aan de Maas | Municipality | ... | 40,857 | 41,814 | 42,271 | 43,923 | → |
| Kerkrade | Municipality | 51,065 | 48,334 | 47,409 | 45,823 | 45,302 | → |
| Landgraaf | Municipality | 40,768 | 38,748 | 38,186 | 37,612 | 37,105 | → |
| Leudal | Municipality | 36,689 | 36,744 | 36,600 | 35,857 | 36,018 | → |
| Maasgouw | Municipality | 24,597 | 24,545 | 24,272 | 23,697 | 24,404 | → |
| Maastricht | Municipality | 122,161 | 118,004 | 119,664 | 122,723 | 125,203 | → |
| Meerssen | Municipality | 20,245 | 19,744 | 19,495 | 19,039 | 18,568 | → |
| Mook en Middelaar | Municipality | 7,978 | 8,084 | 7,947 | 7,768 | 8,153 | → |
| Nederweert | Municipality | 16,171 | 16,665 | 16,678 | 17,038 | 17,492 | → |
| Peel en Maas | Municipality | 42,301 | 42,688 | 43,188 | 43,312 | 45,551 | → |
| Roerdalen | Municipality | 21,566 | 21,142 | 21,239 | 20,728 | 20,806 | → |
| Roermond | Municipality | 53,767 | 54,446 | 55,595 | 57,761 | 60,749 | → |
| Simpelveld | Municipality | 11,500 | 11,206 | 10,953 | 10,561 | 10,252 | → |
| Sittard-Geleen | Municipality | 97,923 | 95,691 | 94,814 | 92,956 | 92,624 | → |
| Stein (L.) | Municipality | 26,428 | 26,091 | 25,709 | 24,987 | 24,748 | → |
| Vaals | Municipality | 10,838 | 9,838 | 9,805 | 9,874 | 10,120 | → |
| Valkenburg aan de Geul | Municipality | 17,884 | 17,099 | 17,024 | 16,431 | 16,425 | → |
| Venlo | Municipality | 99,541 | 100,615 | 99,793 | 101,192 | 103,785 | → |
| Venray | Municipality | ... | 42,530 | 42,784 | 43,341 | 44,668 | → |
| Voerendaal | Municipality | 13,141 | 12,757 | 12,664 | 12,390 | 12,378 | → |
| Weert | Municipality | 48,151 | 48,305 | 48,563 | 49,855 | 51,060 | → |
| Nederland [Netherlands] | Country | 15,985,538 | 16,405,399 | 16,655,799 | 17,181,084 | 17,947,684 |
Source: Statistics Netherlands.
Explanation: Provinces and municipalities in the boundaries of 1 January 2024. 2024 population figures are preliminary.
Further information about the population structure:
| Gender (E 2023) | |
|---|---|
| Males | 561,015 |
| Females | 567,352 |
| Age Groups (E 2023) | |
|---|---|
| 0-17 years | 175,651 |
| 18-64 years | 671,072 |
| 65+ years | 281,644 |
| Age Distribution (E 2023) | |
|---|---|
| 90+ years | 10,413 |
| 80-89 years | 60,250 |
| 70-79 years | 131,060 |
| 60-69 years | 169,325 |
| 50-59 years | 169,966 |
| 40-49 years | 123,001 |
| 30-39 years | 129,282 |
| 20-29 years | 133,175 |
| 10-19 years | 108,911 |
| 0-9 years | 92,984 |
| Urbanization (E 2023) | |
|---|---|
| Highly urbanized | 108,480 |
| Strongly urbanized | 280,600 |
| Moderately urbanized | 208,320 |
| Lowly urbanized | 256,700 |
| Rural | 274,260 |
| Citizenhip (E 2023) | |
|---|---|
| Netherlands | 1,035,997 |
| European Union | 58,166 |
| Europe (Rest) | 9,954 |
| Other country | 24,250 |
| Birth Country (E 2023) | |
|---|---|
| Netherlands | 972,568 |
| Other country | 155,799 |