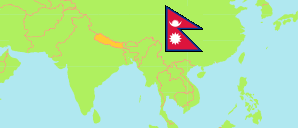
Manra Shisawa
Municipality in Nepal
Contents: Population
The population development of Manra Shisawa as well as related information and services (Wikipedia, Google, images).
| Name | Status | Transcription | Native | Population Census 2001-05-28 | Population Census 2011-06-22 | Population Census 2021-11-25 | |
|---|---|---|---|---|---|---|---|
| Manra Shisawa | Municipality | Manarā Śisavā | मनरा शिसवा नगरपालिका | 44,263 | 49,692 | 52,191 | |
| Nepal | Federal Republic | Nēpāla | नेपाल | 23,151,423 | 26,494,504 | 29,164,578 |
Source: Central Bureau of Statistics Nepal (web).
Explanation: The local units became operational in May 2017. The 2021 population of local units exclude institional population.
Further information about the population structure:
| Gender (C 2021) | |
|---|---|
| Males | 25,679 |
| Females | 26,512 |
| Age Groups (C 2021) | |
|---|---|
| 0-14 years | 17,804 |
| 15-64 years | 30,789 |
| 65+ years | 3,598 |
| Age Distribution (C 2021) | |
|---|---|
| 90+ years | 63 |
| 80-89 years | 240 |
| 70-79 years | 1,723 |
| 60-69 years | 3,283 |
| 50-59 years | 3,941 |
| 40-49 years | 4,880 |
| 30-39 years | 6,415 |
| 20-29 years | 8,379 |
| 10-19 years | 11,307 |
| 0-9 years | 11,960 |
| Citizenhip (C 2021) | |
|---|---|
| Nepal | 51,833 |
| India | 358 |
| Place of Birth (C 2021) | |
|---|---|
| Same local unit | 41,032 |
| Other local unit in same district | 5,112 |
| Other district | 1,658 |
| Other country | 4,383 |
| Literacy (A5+) (C 2021) | |
|---|---|
| Yes | 27,401 |
| Only reading | 117 |
| No | 19,040 |