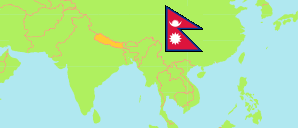
Baitadi
District in Nepal
Contents: Subdivision
The population development in Baitadi as well as related information and services (Wikipedia, Google, images).
| Name | Status | Transcription | Native | Population Census 2001-05-28 | Population Census 2011-06-22 | Population Census 2021-11-25 | |
|---|---|---|---|---|---|---|---|
| Baitadi | District | Baitaḍī | बैतडी जिल्ला | 234,418 | 250,898 | 242,157 | |
| Dasharathchand | Municipality | Daśarathacanda | दशरथचन्द नगरपालिका | ... | 35,211 | 31,567 | → |
| Dilashaini | Rural Municipality | Ḍilāśainī | डिलाशैनी गाउँपालिका | 21,198 | 22,924 | 22,966 | → |
| Dogdakedar | Rural Municipality | Dōgaḍākēdāra | दोगडाकेदार गाउँपालिका | ... | 24,632 | 23,104 | → |
| Melauli | Municipality | Mēlaulī | मेलौली नगरपालिका | ... | 22,545 | 20,658 | → |
| Pancheshwar | Rural Municipality | Pañcēśvara | पञ्चेश्वर गाउँपालिका | ... | 18,766 | 17,796 | → |
| Patan | Municipality | Pāṭana | पाटन नगरपालिका | 29,250 | 30,456 | 29,230 | → |
| Purchaudi | Municipality | Purcauḍī | पुर्चौडी नगरपालिका | 34,374 | 39,190 | 38,281 | → |
| Shivanath | Rural Municipality | Śivanātha | शिवनाथ गाउँपालिका | ... | 17,115 | 18,064 | → |
| Sigas | Rural Municipality | Sigāsa | सिगास गाउँपालिका | ... | 21,510 | 21,814 | → |
| Surnaya | Rural Municipality | Surnayā | सुर्नया गाउँपालिका | ... | 18,549 | 17,945 | → |
| Nepal | Federal Republic | Nēpāla | नेपाल | 23,151,423 | 26,494,504 | 29,164,578 |
Source: Central Bureau of Statistics Nepal (web).
Explanation: The local units became operational in May 2017. The 2021 population of local units exclude institional population.
Further information about the population structure:
| Gender (C 2021) | |
|---|---|
| Males | 113,864 |
| Females | 128,293 |
| Age Groups (C 2021) | |
|---|---|
| 0-14 years | 78,848 |
| 15-64 years | 145,799 |
| 65+ years | 17,510 |
| Age Distribution (C 2021) | |
|---|---|
| 90+ years | 423 |
| 80-89 years | 2,140 |
| 70-79 years | 8,806 |
| 60-69 years | 13,691 |
| 50-59 years | 19,816 |
| 40-49 years | 23,556 |
| 30-39 years | 28,280 |
| 20-29 years | 39,320 |
| 10-19 years | 58,268 |
| 0-9 years | 47,857 |
| Citizenhip (C 2021) | |
|---|---|
| Nepal | 242,124 |
| India | 31 |
| Other Citizenship | 2 |
| Place of Birth (C 2021) | |
|---|---|
| Same local unit | 207,745 |
| Other local unit in same district | 24,130 |
| Other district | 9,617 |
| Other country | 630 |
| Literacy (A5+) (C 2021) | |
|---|---|
| Yes | 168,167 |
| Only reading | 1,232 |
| No | 49,462 |