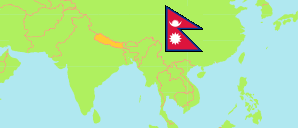
Bajhang
District in Nepal
Contents: Subdivision
The population development in Bajhang as well as related information and services (Wikipedia, Google, images).
| Name | Status | Transcription | Native | Population Census 2001-05-28 | Population Census 2011-06-22 | Population Census 2021-11-25 | |
|---|---|---|---|---|---|---|---|
| Bajhang | District | Bajhāṅa | बझाङ जिल्ला | 167,026 | 195,159 | 189,085 | |
| Bitthadchir | Rural Municipality | Vitthaḍacira | वित्थडचिर गाउँपालिका | 14,164 | 17,163 | 17,812 | → |
| Bungal | Municipality | Buṅgala | बुंगल नगरपालिका | 27,284 | 33,224 | 33,812 | → |
| Chhabispathibhera | Rural Municipality | Chabisapāthibhērā | छबिसपाथिभेरा गाउँपालिका | 14,569 | 16,296 | 14,474 | → |
| Durgathali | Rural Municipality | Durgāthalī | दुर्गाथली गाउँपालिका | 12,022 | 12,980 | 11,318 | → |
| Jaya Prithvi | Municipality | Jayapr̥thvī | जयपृथ्वी नगरपालिका | 19,093 | 22,553 | 21,933 | → |
| Kedarsyu | Rural Municipality | Kēdārasyũ | केदारस्युँ गाउँपालिका | 18,490 | 21,316 | 21,312 | → |
| Khaptadchhanna | Rural Municipality | Khaptaḍachānnā | खप्तडछान्ना गाउँपालिका | 15,715 | 15,903 | 13,419 | → |
| Khaptad National Park | National Park | Khaptaḍa Rāṣṭriya Nikuñja | खप्तड राष्ट्रिय निकुञ्ज | 0 | 0 | 0 | → |
| Masta | Rural Municipality | Maṣṭā | मष्टा गाउँपालिका | 12,114 | 14,951 | 13,265 | → |
| Saipal [Kanda] | Rural Municipality | Sāipāla | साइपाल गाउँपालिका | 1,715 | 2,193 | 2,625 | → |
| Surma | Rural Municipality | Sūrmā | सूर्मा गाउँपालिका | 6,523 | 9,033 | 11,082 | → |
| Talkot | Rural Municipality | Talakōṭa | तलकोट गाउँपालिका | 9,130 | 11,569 | 11,719 | → |
| Thalara | Rural Municipality | Thalārā | थलारा गाउँपालिका | 16,028 | 17,978 | 15,958 | → |
| Nepal | Federal Republic | Nēpāla | नेपाल | 23,151,423 | 26,494,504 | 29,164,578 |
Source: Central Bureau of Statistics Nepal (web).
Explanation: The local units became operational in May 2017. The 2021 population of local units exclude institional population.
Further information about the population structure:
| Gender (C 2021) | |
|---|---|
| Males | 88,470 |
| Females | 100,615 |
| Age Groups (C 2021) | |
|---|---|
| 0-14 years | 68,366 |
| 15-64 years | 107,845 |
| 65+ years | 12,874 |
| Age Distribution (C 2021) | |
|---|---|
| 90+ years | 281 |
| 80-89 years | 1,363 |
| 70-79 years | 6,858 |
| 60-69 years | 9,690 |
| 50-59 years | 13,672 |
| 40-49 years | 17,129 |
| 30-39 years | 20,678 |
| 20-29 years | 28,782 |
| 10-19 years | 49,397 |
| 0-9 years | 41,235 |
| Citizenhip (C 2021) | |
|---|---|
| Nepal | 189,073 |
| India | 8 |
| Other Citizenship | 4 |
| Place of Birth (C 2021) | |
|---|---|
| Same local unit | 167,486 |
| Other local unit in same district | 15,874 |
| Other district | 5,453 |
| Other country | 239 |
| Literacy (A5+) (C 2021) | |
|---|---|
| Yes | 120,205 |
| Only reading | 757 |
| No | 49,392 |