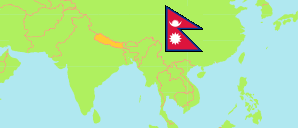
Dolpa
District in Nepal
Contents: Subdivision
The population development in Dolpa as well as related information and services (Wikipedia, Google, images).
| Name | Status | Transcription | Native | Population Census 2001-05-28 | Population Census 2011-06-22 | Population Census 2021-11-25 | |
|---|---|---|---|---|---|---|---|
| Dolpa | District | Ḍōlpā | डोल्पा जिल्ला | 29,545 | 36,700 | 42,774 | |
| Chharka Tangsong | Rural Municipality | Chārkā Tāṅasōṅa | छार्का ताङसोङ गाउँपालिका | 1,283 | 1,451 | 1,672 | → |
| Dolpo Buddha | Rural Municipality | Ḍōlpō Buddha | डोल्पो बुद्ध गाउँपालिका | 1,897 | 2,137 | 2,420 | → |
| Jagdulla | Rural Municipality | Jagadullā | जगदुल्ला गाउँपालिका | ... | 2,322 | 2,575 | → |
| Kaike | Rural Municipality | Kāīkē | काईके गाउँपालिका | ... | 3,303 | 3,965 | → |
| Mudkechula | Rural Municipality | Muḍkēculā | मुड्केचुला गाउँपालिका | 3,933 | 5,165 | 5,803 | → |
| She Phoksundo | Rural Municipality | Śē Phōksunḍō | शे फोक्सुन्डो गाउँपालिका | ... | 3,136 | 3,635 | → |
| Thuli Bheri | Municipality | Ṭhūlī Bhērī | ठूली भेरी नगरपालिका | ... | 8,571 | 9,861 | → |
| Tripurasundari | Municipality | Tripurāsundarī | त्रिपुरासुन्दरी नगरपालिका | ... | 10,615 | 12,233 | → |
| Nepal | Federal Republic | Nēpāla | नेपाल | 23,151,423 | 26,494,504 | 29,164,578 |
Source: Central Bureau of Statistics Nepal (web).
Explanation: The local units became operational in May 2017. The 2021 population of local units exclude institional population.
Further information about the population structure:
| Gender (C 2021) | |
|---|---|
| Males | 21,371 |
| Females | 21,403 |
| Age Groups (C 2021) | |
|---|---|
| 0-14 years | 13,553 |
| 15-64 years | 27,707 |
| 65+ years | 1,514 |
| Age Distribution (C 2021) | |
|---|---|
| 90+ years | 15 |
| 80-89 years | 72 |
| 70-79 years | 707 |
| 60-69 years | 1,856 |
| 50-59 years | 3,014 |
| 40-49 years | 4,288 |
| 30-39 years | 6,159 |
| 20-29 years | 8,318 |
| 10-19 years | 9,922 |
| 0-9 years | 8,423 |
| Citizenhip (C 2021) | |
|---|---|
| Nepal | 42,767 |
| India | 6 |
| Other Citizenship | 1 |
| Place of Birth (C 2021) | |
|---|---|
| Same local unit | 39,805 |
| Other local unit in same district | 1,240 |
| Other district | 1,694 |
| Other country | 17 |
| Literacy (A5+) (C 2021) | |
|---|---|
| Yes | 26,229 |
| Only reading | 486 |
| No | 12,379 |