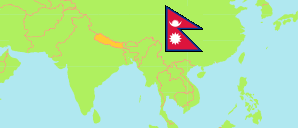
Kapilvastu
District in Nepal
Contents: Subdivision
The population development in Kapilvastu as well as related information and services (Wikipedia, Google, images).
| Name | Status | Transcription | Native | Population Census 2001-05-28 | Population Census 2011-06-22 | Population Census 2021-11-25 | |
|---|---|---|---|---|---|---|---|
| Kapilvastu | District | Kapilavastu | कपिलवस्तु जिल्ला | 481,976 | 571,936 | 682,961 | |
| Banganga | Municipality | Vāṇagaṅgā | वाणगंगा नगरपालिका | 63,449 | 75,354 | 96,714 | → |
| Bijaynagar | Rural Municipality | Vijayanagara | विजयनगर गाउँपालिका | 32,060 | 37,013 | 43,291 | → |
| Buddhabhumi | Municipality | Buddhavāṭikā | बुद्धवाटिका नगरपालिका | 54,590 | 65,458 | 76,507 | → |
| Kapilvastu | Municipality | Kapilavastu | कपिलवस्तु नगरपालिका | 68,059 | 76,894 | 88,874 | → |
| Krishnanagar | Municipality | Kr̥ṣṇanagara | कृष्णनगर नगरपालिका | 52,748 | 62,422 | 70,111 | → |
| Maharajgunj | Municipality | Mahārājagañja | महाराजगंज नगरपालिका | 46,590 | 54,901 | 64,645 | → |
| Mayadevi | Rural Municipality | Māyādēvī | मायादेवी गाउँपालिका | 40,894 | 48,479 | 55,972 | → |
| Shivraj | Municipality | Śivarāja | शिवराज नगरपालिका | 50,886 | 67,162 | 84,810 | → |
| Shuddhodhan | Rural Municipality | Śuddhōdhana | शुद्धोधन गाउँपालिका | 38,468 | 45,301 | 52,861 | → |
| Yasodhara | Rural Municipality | Yasōdharā | यसोधरा गाउँपालिका | 33,540 | 38,952 | 44,900 | → |
| Nepal | Federal Republic | Nēpāla | नेपाल | 23,151,423 | 26,494,504 | 29,164,578 |
Source: Central Bureau of Statistics Nepal (web).
Explanation: The local units became operational in May 2017. The 2021 population of local units exclude institional population.
Further information about the population structure:
| Gender (C 2021) | |
|---|---|
| Males | 334,687 |
| Females | 348,274 |
| Age Groups (C 2021) | |
|---|---|
| 0-14 years | 222,578 |
| 15-64 years | 418,037 |
| 65+ years | 42,346 |
| Age Distribution (C 2021) | |
|---|---|
| 90+ years | 896 |
| 80-89 years | 3,831 |
| 70-79 years | 20,484 |
| 60-69 years | 35,244 |
| 50-59 years | 47,588 |
| 40-49 years | 64,591 |
| 30-39 years | 92,171 |
| 20-29 years | 119,698 |
| 10-19 years | 153,775 |
| 0-9 years | 144,683 |
| Citizenhip (C 2021) | |
|---|---|
| Nepal | 679,910 |
| India | 3,040 |
| Other Citizenship | 10 |
| Place of Birth (C 2021) | |
|---|---|
| Same local unit | 510,386 |
| Other local unit in same district | 48,810 |
| Other district | 82,323 |
| Other country | 41,224 |
| Literacy (A5+) (C 2021) | |
|---|---|
| Yes | 441,191 |
| Only reading | 3,053 |
| No | 169,738 |