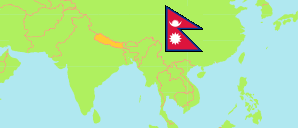
Parasi
District in Nepal
Contents: Subdivision
The population development in Parasi as well as related information and services (Wikipedia, Google, images).
| Name | Status | Transcription | Native | Population Census 2001-05-28 | Population Census 2011-06-22 | Population Census 2021-11-25 | |
|---|---|---|---|---|---|---|---|
| Parasi [Nawalparasi West] | District | Parāsī | परासी जिल्ला | 290,313 | 331,904 | 386,868 | |
| Bardghat | Municipality | Bardaghāṭa | बर्दघाट नगरपालिका | 55,476 | 61,675 | 76,703 | → |
| Palhinandan | Rural Municipality | Pālhīnandana | पाल्हीनन्दन गाउँपालिका | ... | 35,429 | 38,186 | → |
| Pratappur | Rural Municipality | Pratāpapura | प्रतापपुर गाउँपालिका | ... | 45,241 | 49,897 | → |
| Ramgram | Municipality | Rāmagrāma | रामग्राम नगरपालिका | ... | 59,828 | 64,017 | → |
| Sarawal | Rural Municipality | Sarāvala | सरावल गाउँपालिका | 33,647 | 37,418 | 42,207 | → |
| Sunwal | Municipality | Sunavala | सुनवल नगरपालिका | ... | 56,423 | 72,085 | → |
| Susta | Rural Municipality | Sustā | सुस्ता गाउँपालिका | ... | 35,890 | 40,655 | → |
| Nepal | Federal Republic | Nēpāla | नेपाल | 23,151,423 | 26,494,504 | 29,164,578 |
Source: Central Bureau of Statistics Nepal (web).
Explanation: The local units became operational in May 2017. The 2021 population of local units exclude institional population.
Further information about the population structure:
| Gender (C 2021) | |
|---|---|
| Males | 188,182 |
| Females | 198,686 |
| Age Groups (C 2021) | |
|---|---|
| 0-14 years | 101,665 |
| 15-64 years | 258,662 |
| 65+ years | 26,541 |
| Age Distribution (C 2021) | |
|---|---|
| 90+ years | 642 |
| 80-89 years | 2,782 |
| 70-79 years | 12,288 |
| 60-69 years | 22,982 |
| 50-59 years | 32,599 |
| 40-49 years | 42,874 |
| 30-39 years | 59,647 |
| 20-29 years | 72,284 |
| 10-19 years | 74,556 |
| 0-9 years | 66,214 |
| Citizenhip (C 2021) | |
|---|---|
| Nepal | 384,733 |
| India | 2,125 |
| Other country | 10 |
| Place of Birth (C 2021) | |
|---|---|
| Same local unit | 256,772 |
| Other local unit in same district | 30,304 |
| Other district | 69,883 |
| Other country | 29,722 |
| Literacy (A5+) (C 2021) | |
|---|---|
| Yes | 277,362 |
| Only reading | 2,110 |
| No | 76,103 |