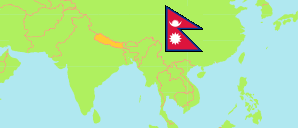
Gulmi
District in Nepal
Contents: Subdivision
The population development in Gulmi as well as related information and services (Wikipedia, Google, images).
| Name | Status | Transcription | Native | Population Census 2001-05-28 | Population Census 2011-06-22 | Population Census 2021-11-25 | |
|---|---|---|---|---|---|---|---|
| Gulmi | District | Gulmī | गुल्मी जिल्ला | 296,654 | 280,160 | 246,494 | |
| Chandrakot | Rural Municipality | Candrakōṭa | चन्द्रकोट गाउँपालिका | 24,502 | 21,907 | 18,662 | → |
| Chhatrakot | Rural Municipality | Chatrakōṭa | छत्रकोट गाउँपालिका | 23,461 | 21,504 | 19,357 | → |
| Dhurkot | Rural Municipality | Dhurkōṭa | धुर्कोट गाउँपालिका | ... | 22,468 | 18,814 | → |
| Gulmi Darbar | Rural Municipality | Gulmī Darabāra | गुल्मी दरबार गाउँपालिका | 24,373 | 22,047 | 19,296 | → |
| Isma | Rural Municipality | Īsmā | ईस्मा गाउँपालिका | 21,925 | 21,030 | 18,529 | → |
| Kaligandaki | Rural Municipality | Kālīgaṇḍakī | कालीगण्डकी गाउँपालिका | 22,140 | 18,885 | 15,044 | → |
| Madane | Rural Municipality | Madānē | मदाने गाउँपालिका | 21,949 | 21,948 | 20,022 | → |
| Malika | Rural Municipality | Mālikā | मालिका गाउँपालिका | ... | 21,729 | 20,075 | → |
| Musikot | Municipality | Musikōṭa | मुसिकोट नगरपालिका | ... | 33,000 | 28,454 | → |
| Resunga | Municipality | Rēsuṅagā | रेसुङगा नगरपालिका | ... | 33,225 | 31,551 | → |
| Ruru | Rural Municipality | Rurukṣētra | रुरुक्षेत्र गाउँपालिका | 20,914 | 18,610 | 16,597 | → |
| Satyawati | Rural Municipality | Satyavatī | सत्यवती गाउँपालिका | 26,932 | 23,807 | 19,473 | → |
| Nepal | Federal Republic | Nēpāla | नेपाल | 23,151,423 | 26,494,504 | 29,164,578 |
Source: Central Bureau of Statistics Nepal (web).
Explanation: The local units became operational in May 2017. The 2021 population of local units exclude institional population.
Further information about the population structure:
| Gender (C 2021) | |
|---|---|
| Males | 112,025 |
| Females | 134,469 |
| Age Groups (C 2021) | |
|---|---|
| 0-14 years | 67,512 |
| 15-64 years | 154,485 |
| 65+ years | 24,497 |
| Age Distribution (C 2021) | |
|---|---|
| 90+ years | 555 |
| 80-89 years | 3,248 |
| 70-79 years | 11,828 |
| 60-69 years | 20,511 |
| 50-59 years | 25,226 |
| 40-49 years | 24,996 |
| 30-39 years | 30,214 |
| 20-29 years | 38,017 |
| 10-19 years | 48,775 |
| 0-9 years | 43,124 |
| Citizenhip (C 2021) | |
|---|---|
| Nepal | 246,367 |
| India | 124 |
| Other Citizenship | 3 |
| Place of Birth (C 2021) | |
|---|---|
| Same local unit | 191,661 |
| Other local unit in same district | 31,484 |
| Other district | 20,534 |
| Other country | 2,696 |
| Literacy (A5+) (C 2021) | |
|---|---|
| Yes | 182,112 |
| Only reading | 1,495 |
| No | 43,004 |