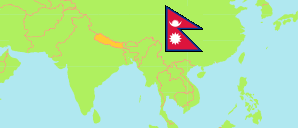
Manang
District in Nepal
Contents: Subdivision
The population development in Manang as well as related information and services (Wikipedia, Google, images).
| Name | Status | Transcription | Native | Population Census 2001-05-28 | Population Census 2011-06-22 | Population Census 2021-11-25 | |
|---|---|---|---|---|---|---|---|
| Manang | District | Manāṅa | मनाङ जिल्ला | 9,587 | 6,538 | 5,658 | |
| Chame | Rural Municipality | Cāmē | चामे गाउँपालिका | ... | 1,476 | 1,276 | → |
| Manang Ngisyang [Neshyang] | Rural Municipality | Manāṅa Ṅisyāṅa | मनाङ ङिस्याङ गाउँपालिका | ... | 2,414 | 1,595 | → |
| Narpa Bhumi [Narphu] | Rural Municipality | Nārpā Bhūmi | नार्पा भूमि गाउँपालिका | ... | 554 | 396 | → |
| Nasong | Rural Municipality | Nāśōṅa | नाशोङ गाउँपालिका | ... | 2,094 | 1,671 | → |
| Nepal | Federal Republic | Nēpāla | नेपाल | 23,151,423 | 26,494,504 | 29,164,578 |
Source: Central Bureau of Statistics Nepal (web).
Explanation: The local units became operational in May 2017. The 2021 population of local units exclude institional population.
Further information about the population structure:
| Gender (C 2021) | |
|---|---|
| Males | 3,192 |
| Females | 2,466 |
| Age Groups (C 2021) | |
|---|---|
| 0-14 years | 846 |
| 15-64 years | 4,267 |
| 65+ years | 545 |
| Age Distribution (C 2021) | |
|---|---|
| 90+ years | 11 |
| 80-89 years | 76 |
| 70-79 years | 240 |
| 60-69 years | 437 |
| 50-59 years | 601 |
| 40-49 years | 795 |
| 30-39 years | 1,181 |
| 20-29 years | 1,172 |
| 10-19 years | 574 |
| 0-9 years | 571 |
| Citizenhip (C 2021) | |
|---|---|
| Nepal | 5,646 |
| India | 9 |
| Other country | 3 |
| Place of Birth (C 2021) | |
|---|---|
| Same local unit | 3,209 |
| Other local unit in same district | 247 |
| Other district | 2,176 |
| Other country | 22 |
| Literacy (A5+) (C 2021) | |
|---|---|
| Yes | 4,215 |
| Only reading | 143 |
| No | 1,021 |