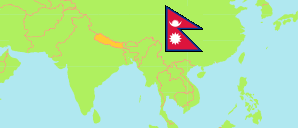
Tanahun
District in Nepal
Contents: Subdivision
The population development in Tanahun as well as related information and services (Wikipedia, Google, images).
| Name | Status | Transcription | Native | Population Census 2001-05-28 | Population Census 2011-06-22 | Population Census 2021-11-25 | |
|---|---|---|---|---|---|---|---|
| Tanahun | District | Tanahũ | तनहुँ जिल्ला | 315,237 | 323,288 | 321,153 | |
| Anbukhaireni | Rural Municipality | Ā̃bukhairēnī | आँबुखैरेनी गाउँपालिका | 18,489 | 20,840 | 22,252 | → |
| Bandipur | Rural Municipality | Bandīpura | बन्दीपुर गाउँपालिका | ... | 20,077 | 18,532 | → |
| Bhanu | Municipality | Bhānu | भानु नगरपालिका | ... | 46,179 | 42,794 | → |
| Bhimad | Municipality | Bhimāda | भिमाद नगरपालिका | ... | 31,362 | 29,248 | → |
| Devghat | Rural Municipality | Dēvaghāṭa | देवघाट गाउँपालिका | ... | 16,478 | 14,584 | → |
| Ghiring | Rural Municipality | Ghiriṅa | घिरिङ गाउँपालिका | ... | 19,318 | 14,334 | → |
| Myagde | Rural Municipality | Myāgdē | म्याग्दे गाउँपालिका | 23,370 | 22,502 | 23,578 | → |
| Rhishing | Rural Municipality | R̥ṣiṅga | ऋषिङ्ग गाउँपालिका | ... | 25,870 | 17,918 | → |
| Shuklagandaki | Municipality | Śuklagaṇḍakī | शुक्लगण्डकी नगरपालिका | ... | 49,611 | 55,620 | → |
| Vyas | Municipality | Vyāsa | व्यास नगरपालिका | ... | 71,051 | 78,939 | → |
| Nepal | Federal Republic | Nēpāla | नेपाल | 23,151,423 | 26,494,504 | 29,164,578 |
Source: Central Bureau of Statistics Nepal (web).
Explanation: The local units became operational in May 2017. The 2021 population of local units exclude institional population.
Further information about the population structure:
| Gender (C 2021) | |
|---|---|
| Males | 150,094 |
| Females | 171,059 |
| Age Groups (C 2021) | |
|---|---|
| 0-14 years | 77,182 |
| 15-64 years | 214,839 |
| 65+ years | 29,132 |
| Age Distribution (C 2021) | |
|---|---|
| 90+ years | 754 |
| 80-89 years | 4,010 |
| 70-79 years | 13,450 |
| 60-69 years | 24,488 |
| 50-59 years | 32,101 |
| 40-49 years | 36,500 |
| 30-39 years | 46,014 |
| 20-29 years | 55,160 |
| 10-19 years | 60,366 |
| 0-9 years | 48,310 |
| Citizenhip (C 2021) | |
|---|---|
| Nepal | 319,347 |
| India | 1,787 |
| Other Citizenship | 12 |
| Place of Birth (C 2021) | |
|---|---|
| Same local unit | 207,510 |
| Other local unit in same district | 47,403 |
| Other district | 59,979 |
| Other country | 5,836 |
| Literacy (A5+) (C 2021) | |
|---|---|
| Yes | 244,178 |
| Only reading | 2,048 |
| No | 52,457 |