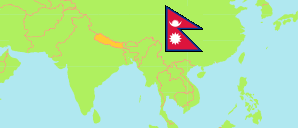
Chitwan
District in Nepal
Contents: Subdivision
The population development in Chitwan as well as related information and services (Wikipedia, Google, images).
| Name | Status | Transcription | Native | Population Census 2001-05-28 | Population Census 2011-06-22 | Population Census 2021-11-25 | |
|---|---|---|---|---|---|---|---|
| Chitwan | District | Citavana | चितवन जिल्ला | 472,048 | 579,984 | 719,859 | |
| Bharatpur | Metropolis | Bharatapura | भरतपुर महानगरपालिका | 210,593 | 285,167 | 369,268 | → |
| Chitawan National Park | National Park | Citavana Rāṣṭriya Nikuñja | चितवन राष्ट्रिय निकुञ्ज | 0 | 0 | 0 | → |
| Ichchhakamana | Rural Municipality | Icchākāmanā | इच्छाकामना गाउँपालिका | 21,924 | 25,067 | 27,643 | → |
| Kalika | Municipality | Kālikā | कालिका नगरपालिका | ... | 44,898 | 52,164 | → |
| Khairhani | Municipality | Khairahanī | खैरहनी नगरपालिका | 50,372 | 56,925 | 67,385 | → |
| Madi | Municipality | Māḍī | माडी नगरपालिका | 41,344 | 37,764 | 38,295 | → |
| Rapti | Municipality | Rāptī | राप्ती नगरपालिका | ... | 59,937 | 66,617 | → |
| Ratnanagar | Municipality | Ratnanagara | रत्ननगर नगरपालिका | 58,824 | 70,226 | 89,905 | → |
| Nepal | Federal Republic | Nēpāla | नेपाल | 23,151,423 | 26,494,504 | 29,164,578 |
Source: Central Bureau of Statistics Nepal (web).
Explanation: The local units became operational in May 2017. The 2021 population of local units exclude institional population.
Further information about the population structure:
| Gender (C 2021) | |
|---|---|
| Males | 351,789 |
| Females | 368,070 |
| Age Groups (C 2021) | |
|---|---|
| 0-14 years | 167,736 |
| 15-64 years | 499,755 |
| 65+ years | 52,368 |
| Age Distribution (C 2021) | |
|---|---|
| 90+ years | 1,715 |
| 80-89 years | 7,805 |
| 70-79 years | 23,894 |
| 60-69 years | 43,899 |
| 50-59 years | 67,998 |
| 40-49 years | 89,252 |
| 30-39 years | 112,967 |
| 20-29 years | 135,302 |
| 10-19 years | 129,039 |
| 0-9 years | 107,988 |
| Citizenhip (C 2021) | |
|---|---|
| Nepal | 712,833 |
| India | 6,956 |
| Other Citizenship | 70 |
| Place of Birth (C 2021) | |
|---|---|
| Same local unit | 380,326 |
| Other local unit in same district | 45,209 |
| Other district | 275,604 |
| Other country | 18,624 |
| Literacy (A5+) (C 2021) | |
|---|---|
| Yes | 560,119 |
| Only reading | 2,188 |
| No | 107,052 |