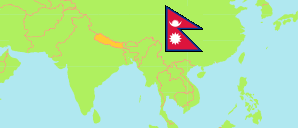
Parsa
District in Nepal
Contents: Subdivision
The population development in Parsa as well as related information and services (Wikipedia, Google, images).
| Name | Status | Transcription | Native | Population Census 2001-05-28 | Population Census 2011-06-22 | Population Census 2021-11-25 | |
|---|---|---|---|---|---|---|---|
| Parsa | District | Parsā | पर्सा जिल्ला | 497,219 | 601,017 | 654,471 | |
| Bahudarmai | Municipality | Bahudaramāī | बहुदरमाई नगरपालिका | 32,007 | 39,673 | 43,478 | → |
| Bindabasini | Rural Municipality | Bindabāsinī | बिन्दबासिनी गाउँपालिका | 19,556 | 24,468 | 24,991 | → |
| Birgunj | Metropolis | Vīragañja | वीरगंज महानगरपालिका | 194,960 | 244,086 | 272,382 | → |
| Chhipahrmai | Rural Municipality | Chipaharamāī | छिपहरमाई गाउँपालिका | 21,939 | 26,684 | 29,082 | → |
| Chitawan National Park | National Park | Citavana Rāṣṭriya Nikuñja | चितवन राष्ट्रिय निकुञ्ज | 0 | 0 | 0 | → |
| Dhobini | Rural Municipality | Dhōbīnī | धोबीनी गाउँपालिका | ... | 19,911 | 22,606 | → |
| Jagarnathpur | Rural Municipality | Jagaranāthapura | जगरनाथपुर गाउँपालिका | ... | 32,674 | 32,649 | → |
| Jira Bhawani | Rural Municipality | Jirā Bhavānī | जिरा भवानी गाउँपालिका | 19,876 | 22,765 | 22,677 | → |
| Kalikamai | Rural Municipality | Kālikāmāī | कालिकामाई गाउँपालिका | 17,225 | 21,141 | 23,480 | → |
| Pakahamainpur | Rural Municipality | Pakāhā Mainapura | पकाहा मैनपुर गाउँपालिका | 17,081 | 20,717 | 22,585 | → |
| Parsagadhi | Municipality | Parsāgaḍhī | पर्सागढी नगरपालिका | 31,948 | 38,607 | 41,569 | → |
| Paterwa Sugauli | Rural Municipality | Paṭērvā Sugaulī | पटेर्वा सुगौली गाउँपालिका | 19,894 | 23,917 | 25,498 | → |
| Pokhariya | Municipality | Pōkhariyā | पोखरिया नगरपालिका | ... | 32,885 | 37,675 | → |
| Sakhuwa Prasauni | Rural Municipality | Sakhuvā Prasaunī | सखुवा प्रसौनी गाउँपालिका | 28,040 | 33,092 | 35,399 | → |
| Thori | Rural Municipality | Ṭhōrī | ठोरी गाउँपालिका | 20,651 | 20,397 | 17,219 | → |
| Nepal | Federal Republic | Nēpāla | नेपाल | 23,151,423 | 26,494,504 | 29,164,578 |
Source: Central Bureau of Statistics Nepal (web).
Explanation: The local units became operational in May 2017. The 2021 population of local units exclude institional population.
Further information about the population structure:
| Gender (C 2021) | |
|---|---|
| Males | 338,286 |
| Females | 316,185 |
| Age Groups (C 2021) | |
|---|---|
| 0-14 years | 209,682 |
| 15-64 years | 406,993 |
| 65+ years | 37,796 |
| Age Distribution (C 2021) | |
|---|---|
| 90+ years | 689 |
| 80-89 years | 3,087 |
| 70-79 years | 18,182 |
| 60-69 years | 33,598 |
| 50-59 years | 46,971 |
| 40-49 years | 68,239 |
| 30-39 years | 92,479 |
| 20-29 years | 111,850 |
| 10-19 years | 144,111 |
| 0-9 years | 135,265 |
| Citizenhip (C 2021) | |
|---|---|
| Nepal | 647,847 |
| India | 6,601 |
| Other Citizenship | 23 |
| Place of Birth (C 2021) | |
|---|---|
| Same local unit | 499,464 |
| Other local unit in same district | 64,372 |
| Other district | 46,283 |
| Other country | 44,296 |
| Literacy (A5+) (C 2021) | |
|---|---|
| Yes | 409,631 |
| Only reading | 1,737 |
| No | 181,143 |