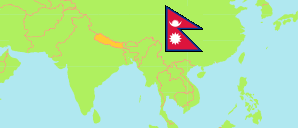
Makwanpur
District in Nepal
Contents: Subdivision
The population development in Makwanpur as well as related information and services (Wikipedia, Google, images).
| Name | Status | Transcription | Native | Population Census 2001-05-28 | Population Census 2011-06-22 | Population Census 2021-11-25 | |
|---|---|---|---|---|---|---|---|
| Makwanpur | District | Makavānapura | मकवानपुर जिल्ला | 392,604 | 420,477 | 466,073 | |
| Bagmati | Rural Municipality | Bāgmati | बाग्मति गाउँपालिका | 30,677 | 30,587 | 30,425 | → |
| Bakaiya | Rural Municipality | Bakaiyā | बकैया गाउँपालिका | 39,846 | 39,642 | 40,907 | → |
| Bhimphedi | Rural Municipality | Bhīmaphēdī | भीमफेदी गाउँपालिका | ... | 24,960 | 21,516 | → |
| Chitawan National Park | National Park | Citavana Rāṣṭriya Nikuñja | चितवन राष्ट्रिय निकुञ्ज | 0 | 0 | 0 | → |
| Hetauda | Sub-Metropolis | Hēṭauṇḍā | हेटौंडा उपमहानगरपालिका | 129,872 | 154,660 | 193,576 | → |
| Indrasarowar | Rural Municipality | Indrasarōvara | इन्द्रसरोवर गाउँपालिका | 15,325 | 13,891 | 13,534 | → |
| Kailash | Rural Municipality | Kailāśa | कैलाश गाउँपालिका | ... | 23,922 | 21,856 | → |
| Makawanpurgadhi | Rural Municipality | Makavānapuragaḍhī | मकवानपुरगढी गाउँपालिका | 26,959 | 25,379 | 24,461 | → |
| Manahari | Rural Municipality | Manaharī | मनहरी गाउँपालिका | ... | 39,122 | 47,353 | → |
| Parsa Wildlife Reserve | Wildlife Reserve | Parsā Vanyajantu Ārakṣa | पर्सा वन्यजन्तु आरक्ष | 0 | 0 | 0 | → |
| Raksirang | Rural Municipality | Rāksirāṅga | राक्सिराङ्ग गाउँपालिका | 25,675 | 26,192 | 25,996 | → |
| Thaha | Municipality | Thāhā | थाहा नगरपालिका | 42,230 | 42,122 | 38,870 | → |
| Nepal | Federal Republic | Nēpāla | नेपाल | 23,151,423 | 26,494,504 | 29,164,578 |
Source: Central Bureau of Statistics Nepal (web).
Explanation: The local units became operational in May 2017. The 2021 population of local units exclude institional population.
Further information about the population structure:
| Gender (C 2021) | |
|---|---|
| Males | 233,816 |
| Females | 232,257 |
| Age Groups (C 2021) | |
|---|---|
| 0-14 years | 119,722 |
| 15-64 years | 315,589 |
| 65+ years | 30,762 |
| Age Distribution (C 2021) | |
|---|---|
| 90+ years | 835 |
| 80-89 years | 4,267 |
| 70-79 years | 13,987 |
| 60-69 years | 27,046 |
| 50-59 years | 40,815 |
| 40-49 years | 51,639 |
| 30-39 years | 71,521 |
| 20-29 years | 89,194 |
| 10-19 years | 89,972 |
| 0-9 years | 76,797 |
| Citizenhip (C 2021) | |
|---|---|
| Nepal | 464,185 |
| India | 1,861 |
| Other Citizenship | 27 |
| Place of Birth (C 2021) | |
|---|---|
| Same local unit | 327,976 |
| Other local unit in same district | 52,019 |
| Other district | 82,039 |
| Other country | 3,960 |
| Literacy (A5+) (C 2021) | |
|---|---|
| Yes | 334,161 |
| Only reading | 1,112 |
| No | 94,136 |