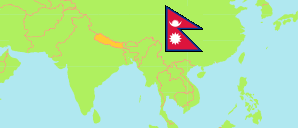
Dhading
District in Nepal
Contents: Subdivision
The population development in Dhading as well as related information and services (Wikipedia, Google, images).
| Name | Status | Transcription | Native | Population Census 2001-05-28 | Population Census 2011-06-22 | Population Census 2021-11-25 | |
|---|---|---|---|---|---|---|---|
| Dhading | District | Dhādiṅa | धादिङ जिल्ला | 338,658 | 336,067 | 325,710 | |
| Benighat Rorang | Rural Municipality | Bēnīghāṭa Rōrāṅga | बेनीघाट रोराङ्ग गाउँपालिका | 27,699 | 31,475 | 33,854 | → |
| Dhunibeshi | Municipality | Dhunivēśī | धुनिवेशी नगरपालिका | 31,029 | 31,029 | 29,149 | → |
| Gajuri | Rural Municipality | Gajurī | गजुरी गाउँपालिका | ... | 27,841 | 28,634 | → |
| Galchhi | Rural Municipality | Galchī | गल्छी गाउँपालिका | ... | 26,215 | 23,733 | → |
| Gangajamuna | Rural Municipality | Gaṅgājamunā | गङ्गाजमुना गाउँपालिका | 25,591 | 21,784 | 19,265 | → |
| Jwalamukhi | Rural Municipality | Jvālāmūkhī | ज्वालामूखी गाउँपालिका | 26,225 | 23,966 | 21,338 | → |
| Khaniyabas | Rural Municipality | Khaniyābāsa | खनियाबास गाउँपालिका | 13,530 | 12,749 | 10,287 | → |
| Netrawati Dabjong | Rural Municipality | Nētrāvatī Ḍabajōṅa | नेत्रावती डबजोङ गाउँपालिका | 15,699 | 12,870 | 11,310 | → |
| Nilkantha | Municipality | Nīlakaṇṭha | नीलकण्ठ नगरपालिका | 55,696 | 58,876 | 58,828 | → |
| Rubi Bhyali [Rubi Valley] | Rural Municipality | Ruvī Bhyālī | रुवी भ्याली गाउँपालिका | 10,376 | 9,562 | 10,781 | → |
| Siddhalek | Rural Municipality | Siddhalēka | सिद्धलेक गाउँपालिका | 24,594 | 23,729 | 22,214 | → |
| Thakre | Rural Municipality | Thākrē | थाक्रे गाउँपालिका | ... | 32,979 | 32,374 | → |
| Tripurasundari | Rural Municipality | Tripurāsundarī | त्रिपुरासुन्दरी गाउँपालिका | 25,096 | 22,992 | 21,937 | → |
| Nepal | Federal Republic | Nēpāla | नेपाल | 23,151,423 | 26,494,504 | 29,164,578 |
Source: Central Bureau of Statistics Nepal (web).
Explanation: The local units became operational in May 2017. The 2021 population of local units exclude institional population.
Further information about the population structure:
| Gender (C 2021) | |
|---|---|
| Males | 159,048 |
| Females | 166,662 |
| Age Groups (C 2021) | |
|---|---|
| 0-14 years | 82,595 |
| 15-64 years | 211,225 |
| 65+ years | 31,890 |
| Age Distribution (C 2021) | |
|---|---|
| 90+ years | 1,084 |
| 80-89 years | 4,922 |
| 70-79 years | 14,900 |
| 60-69 years | 24,667 |
| 50-59 years | 31,676 |
| 40-49 years | 34,618 |
| 30-39 years | 44,015 |
| 20-29 years | 55,377 |
| 10-19 years | 62,880 |
| 0-9 years | 51,571 |
| Citizenhip (C 2021) | |
|---|---|
| Nepal | 324,770 |
| India | 696 |
| Other Citizenship | 244 |
| Place of Birth (C 2021) | |
|---|---|
| Same local unit | 262,226 |
| Other local unit in same district | 35,361 |
| Other district | 26,586 |
| Other country | 1,484 |
| Literacy (A5+) (C 2021) | |
|---|---|
| Yes | 218,424 |
| Only reading | 783 |
| No | 82,454 |