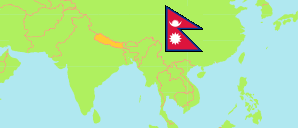
Kavrepalanchok
District in Nepal
Contents: Subdivision
The population development in Kavrepalanchok as well as related information and services (Wikipedia, Google, images).
| Name | Status | Transcription | Native | Population Census 2001-05-28 | Population Census 2011-06-22 | Population Census 2021-11-25 | |
|---|---|---|---|---|---|---|---|
| Kavrepalanchok | District | Kābhrēpalāñcōka | काभ्रेपलाञ्चोक जिल्ला | 385,672 | 381,937 | 364,039 | |
| Banepa | Municipality | Banēpā | बनेपा नगरपालिका | ... | 57,722 | 67,690 | → |
| Bethanchok | Rural Municipality | Bēthānacōka | बेथानचोक गाउँपालिका | ... | 15,622 | 14,959 | → |
| Bhumlu | Rural Municipality | Bhumlu | भुम्लु गाउँपालिका | ... | 19,298 | 15,678 | → |
| Chaurideurali | Rural Municipality | Cauṃrīdēurālī | चौंरीदेउराली गाउँपालिका | 27,113 | 21,130 | 14,076 | → |
| Dhulikhel | Municipality | Dhulikhēla | धुलिखेल नगरपालिका | ... | 33,981 | 33,726 | → |
| Khanikhola | Rural Municipality | Khānīkhōlā | खानीखोला गाउँपालिका | 14,190 | 14,398 | 12,201 | → |
| Mahabharat | Rural Municipality | Mahābhārata | महाभारत गाउँपालिका | 18,097 | 18,283 | 16,079 | → |
| Mandandeupur | Municipality | Maṇḍanadēupura | मण्डनदेउपुर नगरपालिका | ... | 32,768 | 30,381 | → |
| Namobuddha | Municipality | Namōbuddha | नमोबुद्ध नगरपालिका | 32,489 | 29,926 | 26,160 | → |
| Panauti | Municipality | Panautī | पनौती नगरपालिका | ... | 47,549 | 51,504 | → |
| Panchkhal | Municipality | Pā̃cakhāla | पाँचखाल नगरपालिका | ... | 39,788 | 35,521 | → |
| Roshi | Rural Municipality | Rōśī | रोशी गाउँपालिका | 30,180 | 28,760 | 23,790 | → |
| Temal | Rural Municipality | Tēmāla | तेमाल गाउँपालिका | 26,362 | 22,712 | 16,957 | → |
| Nepal | Federal Republic | Nēpāla | नेपाल | 23,151,423 | 26,494,504 | 29,164,578 |
Source: Central Bureau of Statistics Nepal (web).
Explanation: The local units became operational in May 2017. The 2021 population of local units exclude institional population.
Further information about the population structure:
| Gender (C 2021) | |
|---|---|
| Males | 178,909 |
| Females | 185,130 |
| Age Groups (C 2021) | |
|---|---|
| 0-14 years | 81,948 |
| 15-64 years | 251,268 |
| 65+ years | 30,823 |
| Age Distribution (C 2021) | |
|---|---|
| 90+ years | 748 |
| 80-89 years | 4,472 |
| 70-79 years | 14,435 |
| 60-69 years | 26,510 |
| 50-59 years | 38,782 |
| 40-49 years | 45,253 |
| 30-39 years | 56,074 |
| 20-29 years | 62,655 |
| 10-19 years | 63,232 |
| 0-9 years | 51,878 |
| Citizenhip (C 2021) | |
|---|---|
| Nepal | 363,268 |
| India | 750 |
| Other Citizenship | 21 |
| Place of Birth (C 2021) | |
|---|---|
| Same local unit | 258,500 |
| Other local unit in same district | 54,984 |
| Other district | 49,228 |
| Other country | 1,245 |
| Literacy (A5+) (C 2021) | |
|---|---|
| Yes | 256,899 |
| Only reading | 984 |
| No | 81,552 |