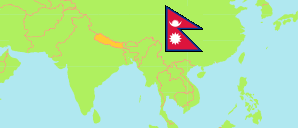
Siraha
District in Nepal
Contents: Subdivision
The population development in Siraha as well as related information and services (Wikipedia, Google, images).
| Name | Status | Transcription | Native | Population Census 2001-05-28 | Population Census 2011-06-22 | Population Census 2021-11-25 | |
|---|---|---|---|---|---|---|---|
| Siraha | District | Sirāhā | सिराहा जिल्ला | 572,399 | 637,328 | 739,953 | |
| Arnama | Rural Municipality | Arnamā | अर्नमा गाउँपालिका | 21,158 | 22,912 | 27,899 | → |
| Aurahi | Rural Municipality | Aurahī | औरही गाउँपालिका | 21,629 | 23,084 | 26,478 | → |
| Bariyarpatti | Rural Municipality | Bariyārapaṭṭī | बरियारपट्टी गाउँपालिका | 22,317 | 25,313 | 29,712 | → |
| Bhagwanpur | Rural Municipality | Bhagavānapura | भगवानपुर गाउँपालिका | 17,468 | 20,999 | 23,380 | → |
| Bishnupur | Rural Municipality | Viṣṇupura | विष्णुपुर गाउँपालिका | 17,144 | 18,543 | 22,781 | → |
| Dhangadhimai | Municipality | Dhanagaḍhīmāī | धनगढीमाई नगरपालिका | 42,337 | 47,449 | 53,355 | → |
| Golbazar | Municipality | Gōlabajāra | गोलबजार नगरपालिका | 47,208 | 52,137 | 63,885 | → |
| Kalyanpur | Municipality | Kalyāṇapura | कल्याणपुर नगरपालिका | 45,812 | 49,344 | 58,872 | → |
| Karjanha | Municipality | Karjanhā | कर्जन्हा नगरपालिका | 26,346 | 31,357 | 38,557 | → |
| Lahan | Municipality | Lahāna | लहान नगरपालिका | 81,918 | 92,040 | 102,031 | → |
| Laksmipur Patari | Rural Municipality | Lakṣmīpura Patārī | लक्ष्मीपुर पतारी गाउँपालिका | ... | 28,073 | 31,118 | → |
| Mirchaiya | Municipality | Mircaiyā | मिर्चैया नगरपालिका | ... | 49,131 | 59,425 | → |
| Naraha | Rural Municipality | Narahā | नरहा गाउँपालिका | 16,834 | 19,369 | 22,760 | → |
| Nawarajpur | Rural Municipality | Navarājapura | नवराजपुर गाउँपालिका | 16,636 | 19,056 | 20,788 | → |
| Sakhuwanankarkatti | Rural Municipality | Sakhuvānānkārakaṭṭī | सखुवानान्कारकट्टी गाउँपालिका | 16,778 | 18,574 | 20,844 | → |
| Siraha | Municipality | Sirāhā | सिराहा नगरपालिका | 75,171 | 82,920 | 95,410 | → |
| Sukhipur | Municipality | Sukhipura | सुखिपुर नगरपालिका | 34,771 | 37,027 | 42,033 | → |
| Nepal | Federal Republic | Nēpāla | नेपाल | 23,151,423 | 26,494,504 | 29,164,578 |
Source: Central Bureau of Statistics Nepal (web).
Explanation: The local units became operational in May 2017. The 2021 population of local units exclude institional population.
Further information about the population structure:
| Gender (C 2021) | |
|---|---|
| Males | 363,724 |
| Females | 376,229 |
| Age Groups (C 2021) | |
|---|---|
| 0-14 years | 245,003 |
| 15-64 years | 446,223 |
| 65+ years | 48,727 |
| Age Distribution (C 2021) | |
|---|---|
| 90+ years | 1,091 |
| 80-89 years | 3,756 |
| 70-79 years | 23,594 |
| 60-69 years | 42,549 |
| 50-59 years | 55,439 |
| 40-49 years | 71,508 |
| 30-39 years | 97,270 |
| 20-29 years | 126,531 |
| 10-19 years | 152,953 |
| 0-9 years | 165,262 |
| Citizenhip (C 2021) | |
|---|---|
| Nepal | 737,136 |
| India | 2,803 |
| Other Citizenship | 14 |
| Place of Birth (C 2021) | |
|---|---|
| Same local unit | 573,752 |
| Other local unit in same district | 97,446 |
| Other district | 46,665 |
| Other country | 22,007 |
| Literacy (A5+) (C 2021) | |
|---|---|
| Yes | 430,205 |
| Only reading | 1,976 |
| No | 228,444 |